The Wikipedia.org Portal and Ukrainian Wikipedia
Executive Summary
On 16 August 2016, Discovery deployed a major design change to the Wikipedia.org Portal page. As of the deployment, the links to Wikipedia in 200+ languages have been put into a modal drop-down to make the page cleaner and less overwhelming to new visitors. Before that, Discovery added browser language preferences detection (via accept-language header) to the page so that users (who have their language preferences set in their browser) would see their language around the Wikipedia globe logo, without having to look for it in the long list of languages. Discovery received some criticism about the change, with some users hypothesizing that the change may have resulted in a decrease to Ukrainian Wikipedia’s pageviews because some visitors may have Russian set as a language, but not Ukrainian.
In this analysis, we use Bayesian structural time series models to model Ukrainian Wikipedia Main Page (since that’s where the Portal leads to) pageviews from Russian-but-not-Ukrainian-speaking visitors to the Wikipedia.org Portal. The effect of the deployment was estimated to be negative in some models and positive in others — including ones that looked at Russian-and-Ukrainian-speaking visitors — but the 95% credible interval included 0 in all of them, meaning the deployment did not have a statistically significant effect. In other words, we do not have sufficient evidence to say that the language-dropdown deployment had a convincingly positive or negative impact on Ukrainian Wikipedia Main Page pageviews from the Wikipedia.org Portal.
{ RMarkdown Source HTML Version / PDF Version | Figures | Analysis Codebase | Phabricator Task | Download PDF }
Background
For the past several months, Discovery’s the Wikipedia.org Portal team has been working on redesigning the (wikipedia.org) page to have a cleaner, more welcoming, and less overwhelming design and user experience. On 16 August 2016, the team deployed a major patch wherein the links to Wikipedia in 200+ languages have been put into a drop-down modal that is hidden by default and is only visible when the user intentionally clicks the “Read in your language” button (see Figure 1a and 1b below).

Figure 1 (a): Default experience when visiting the Wikipedia.org Portal with Russian as the preferred language. Our deployment on August 16th, 2016, collapsed the language links into a hidden-by-default modal in an effort to make the page’s design cleaner and less overwhelming to new visitors.

Figure 1 (b): Link to Ukrainian Wikipedia is only visible by clicking the “Read in your language” button to reveal the modal containing links to Wikipedia in various languages.

Figure 1 (c): How the Wikipedia.org Portal looks to a user who has set their language preferences to Ukrainian (first) and Russian (second). The links to Ukrainian and Russian Wikipedias are now the first links around the globe.
Per some comments in a thread on mediawiki.org, there is a suspicion that the deployment of the collapsed language links has decreased the page views to the Ukrainian Wikipedia as a result of some users’ browsers being configured to Russian, thereby burying the link to the Ukrainian Wikipedia (shown in Figure 1). The goal of this analysis is to test the hypothesis that the deployment has had a negative impact on visits to Ukrainian Wikipedia’s main page from the Wikipedia.org Portal. That is, this analysis is not concerned with Ukrainian Wikipedia overall pageviews or pageviews from somebody searching on the Wikipedia.org Portal and going to a specific article or pageviews from search engines and other sources.
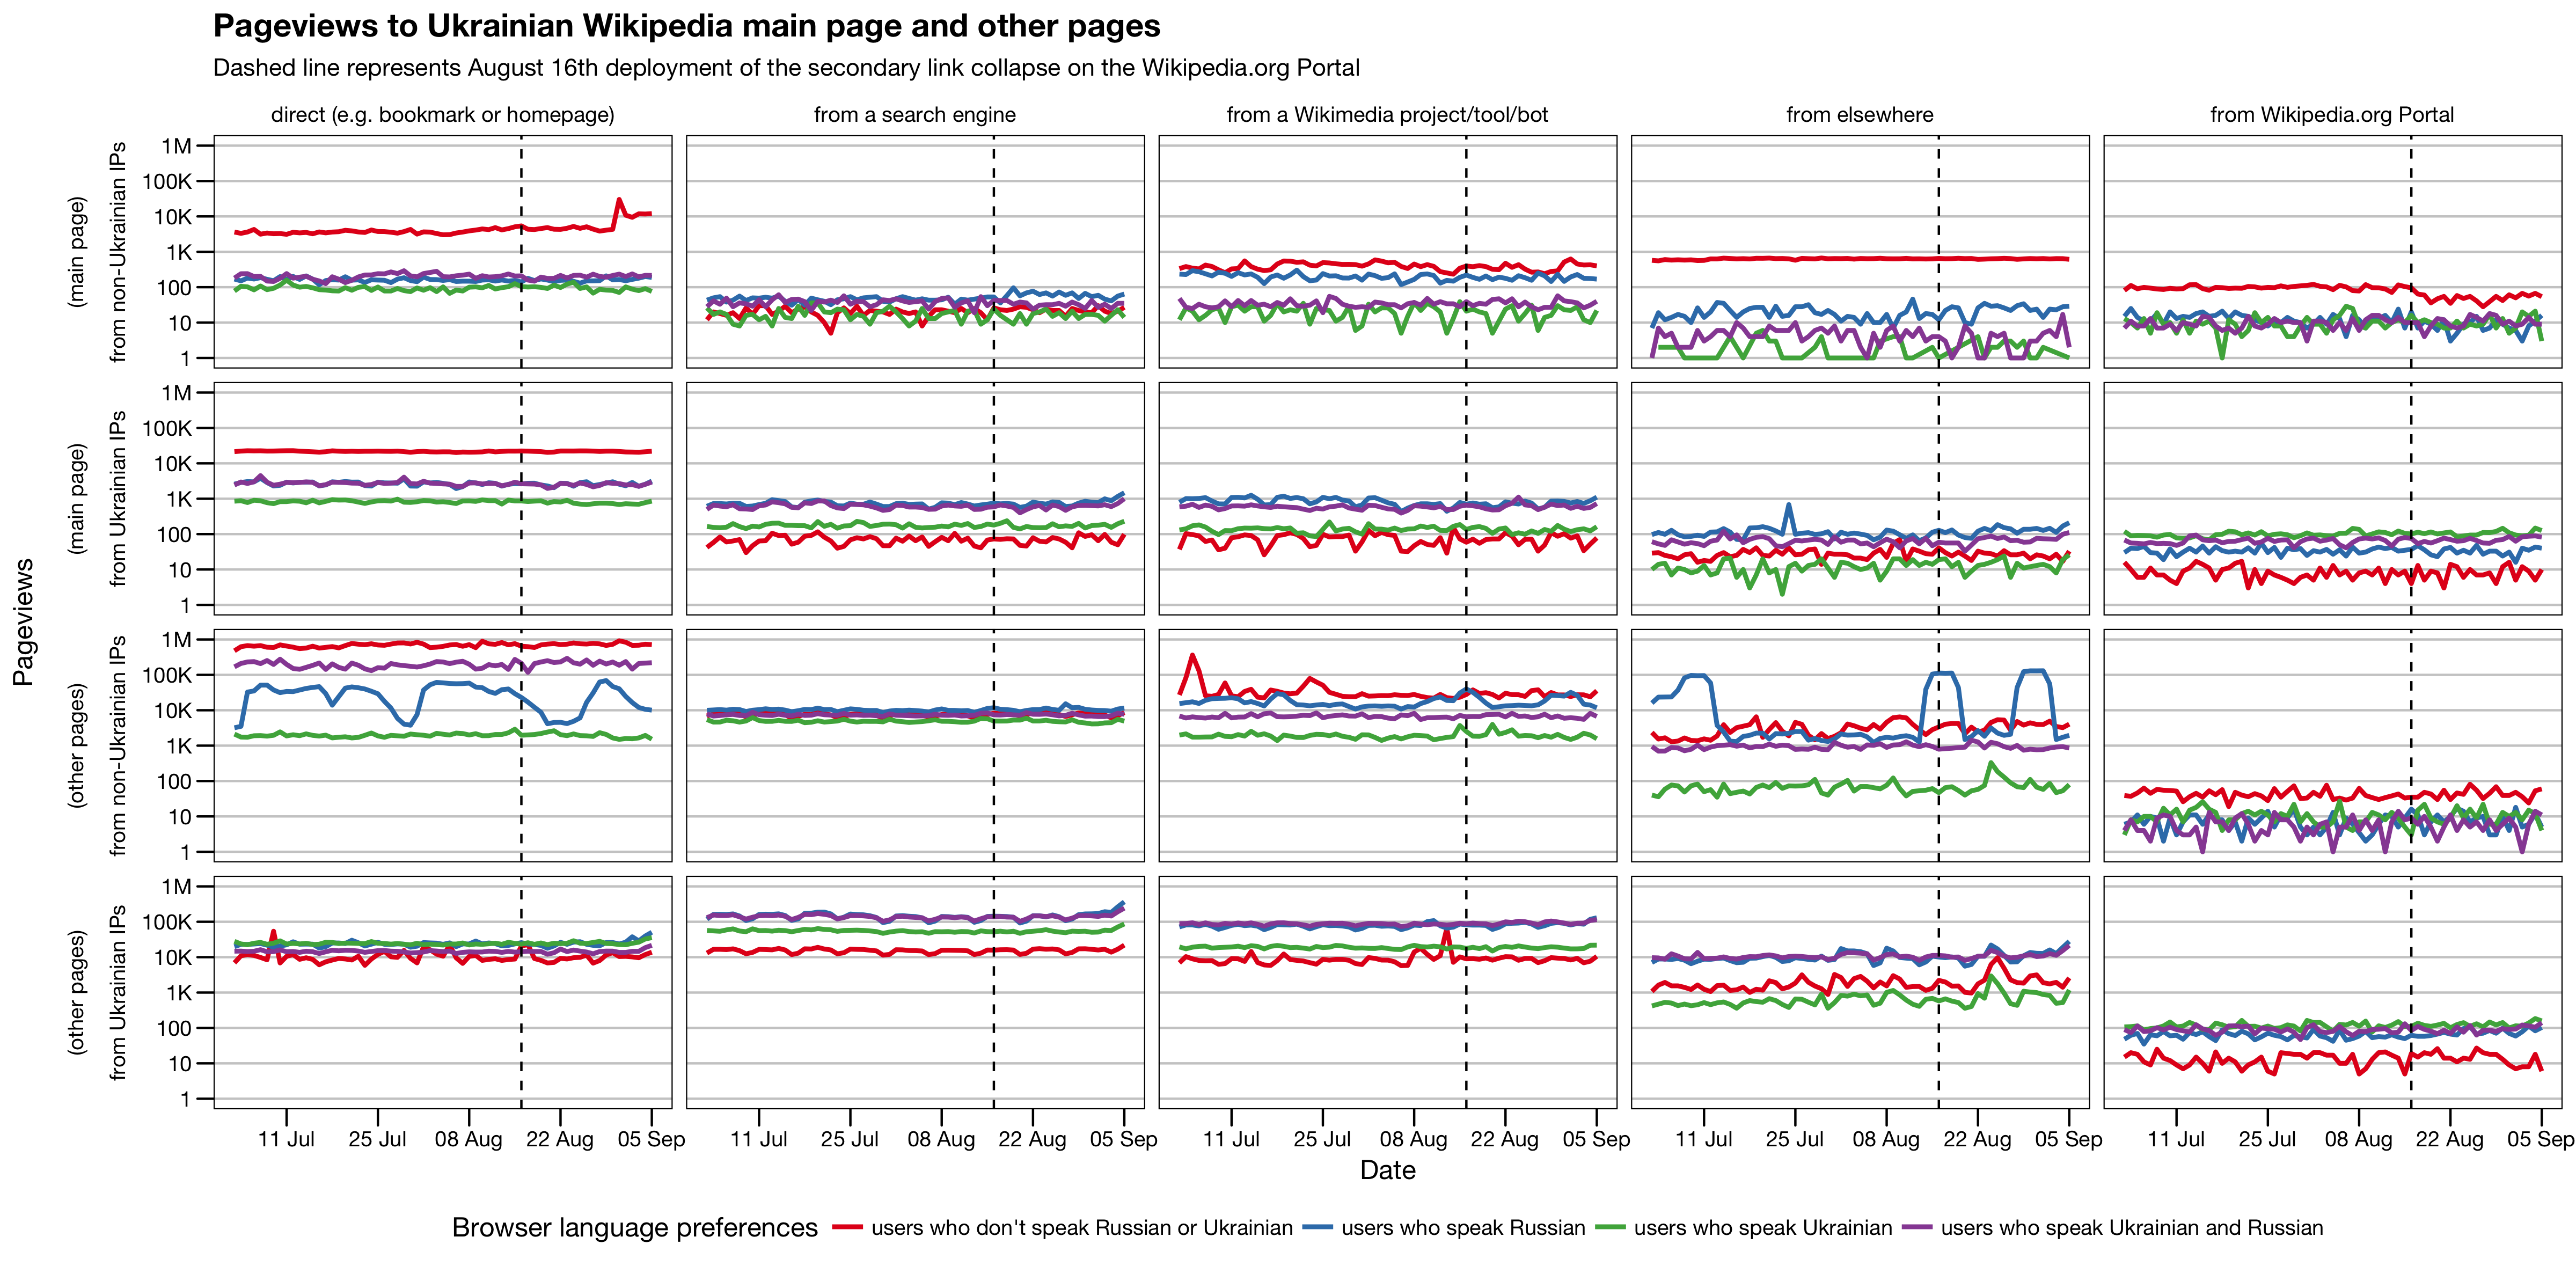
Figure 2: Pageviews (on a log scale) to Ukrainian Wikipedia main page and other pages from users with Ukrainian IP addresses and users with non-Ukrainian IP addresses.
Methods
We used Bayesian structural time series (BSTS) to model Ukrainian Wikipedia main page pageviews from the Wikipedia.org Portal, using the R package “bsts” (Scott et al., 2016). See [1], [2], and [7] for more details.
We tried multiple models, including different combinations of:
- seasonality (weekly & monthly) components,
- a one-back autoregressive (AR1) component,
- specific pageview time series as control time series (e.g. Russian Wikipedia Main Page pageviews from the Wikipedia.org Portal, Ukrainian Wikipedia Main Page pageviews not from the Wikipedia.org Portal),
- dynamic time warping-matched pageview time series (“markets”) as control time series, such as Ukrainian Wikitionary (Main Page) pageviews from a Wikimedia project/tool/bot (which had the 2nd highest similarity).
- a “mix of markets” that included similar markets and markets with the highest posterior inclusion probability via Bayesian variable selection.
When including control time series (e.g. Ukrainian Wikipedia pageviews from a Wikimedia site but not the Wikipedia.org Portal), we used static regression (the coefficients were assumed to not vary over time). Specifically, we set \(Z_t = \beta^T X_t\) and \(\alpha_t = 1\), so that each \(p\)-th covariate had a coefficient \(\beta_p\). All models included an indicator variable \(x_{\text{deployment},t}\) of the Wikipedia.org Portal secondary link collapse patch deployment as a covariate, meaning that \(x_{\text{deployment},t} = 0\) when \(t\) is before 16 August 2016, and \(x_{\text{deployment},t} = 1\) when \(t\) is 16 August 2016 or after, so that \(\beta_{\text{deployment}}\) is the effect of the deployment on Ukrainian Wikipedia main page pageviews from the Wikipedia.org Portal after accounting for variance in pageviews using various control time series.
)](figures/bsts_aggregate_state_contribution_plots-1.png)
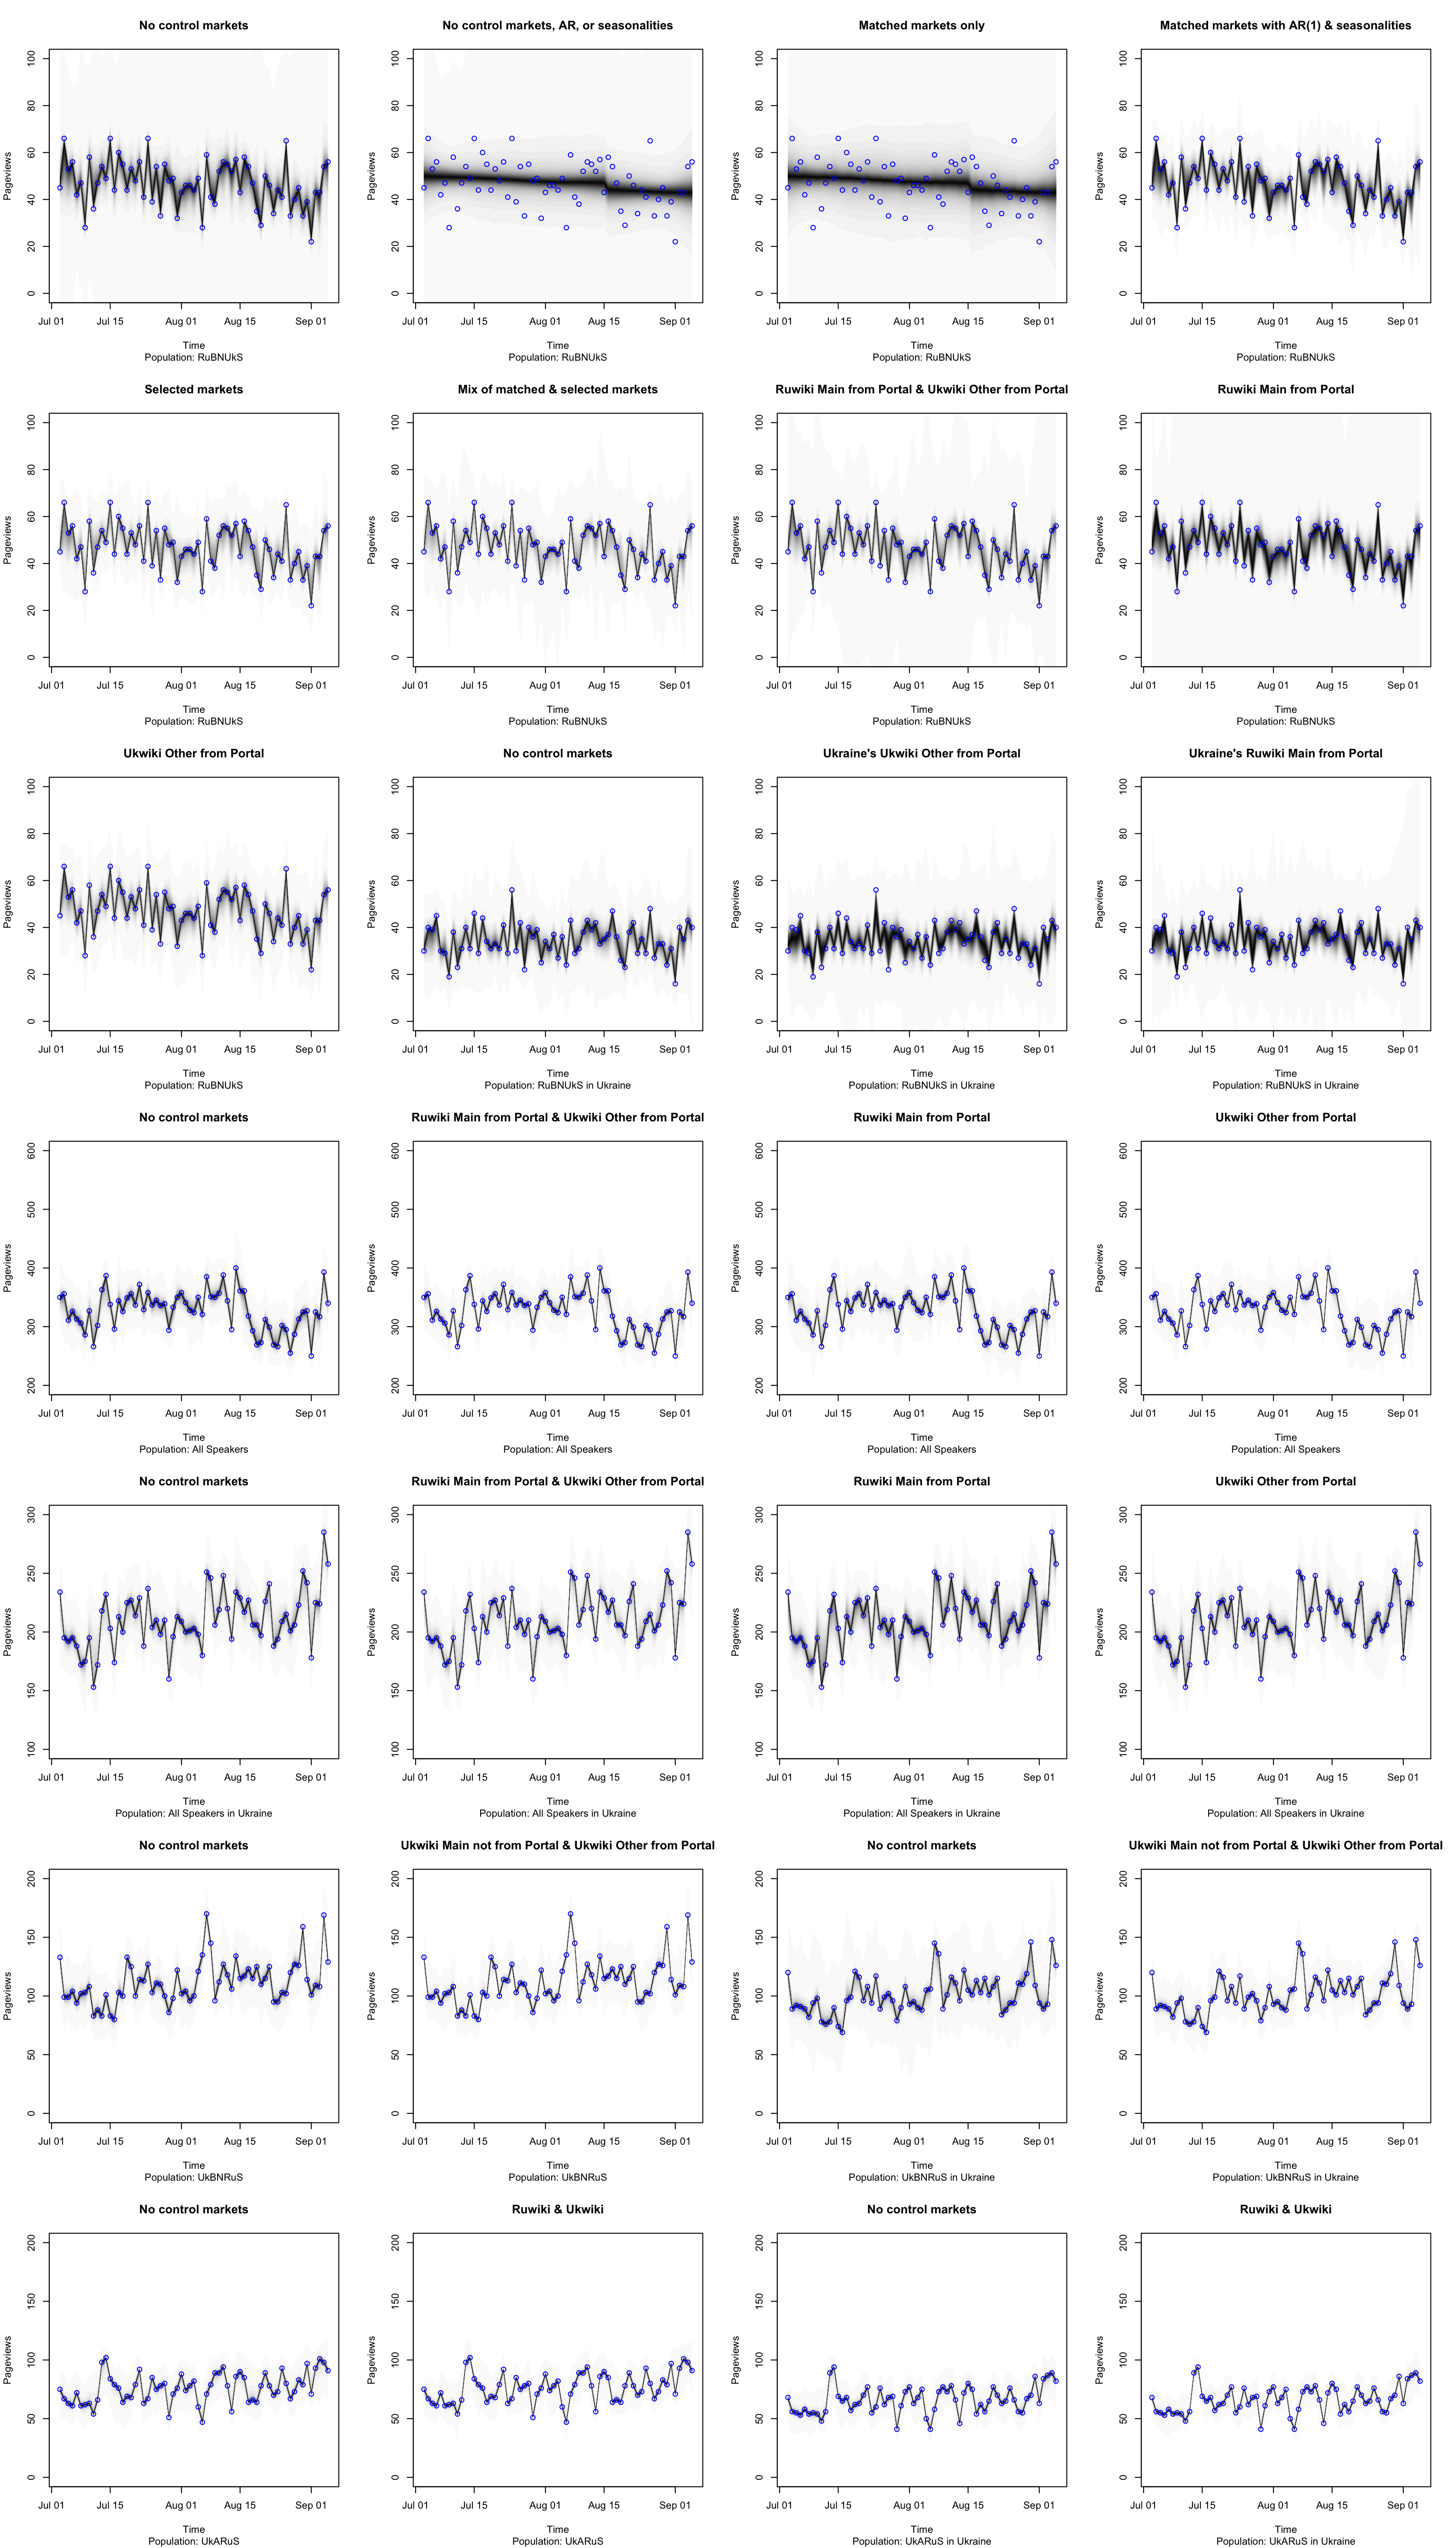
Figure 3: Plots of the 28 BSTS models’ predictions (in black and gray) with actual pageviews (blue circles) for comparison. (Full resolution version)
Twenty-eight different models (but only twelve dealt with Russian-but-not-Ukrainian-speaking populations) were considered (see Figure 3) and nine were chosen according to the models’ R2 (proportion by which the residual variance is less than the variance of the original observations).
Results
| Control | Distance | Correlation |
|---|---|---|
| ukrainian wikivoyage (other pages) from elsewhere | 0.275 | 0.232 |
| ukrainian wiktionary (main page) from a Wikimedia project/tool/bot | 0.309 | -0.241 |
| english wikisource (main page) from elsewhere | 0.345 | 0.044 |
| ukrainian wikivoyage (main page) from a Wikimedia project/tool/bot | 0.358 | 0.024 |
| english wiktionary (main page) from a Wikimedia project/tool/bot | 0.417 | 0.006 |
| ukrainian wikiquote (main page) from a Wikimedia project/tool/bot | 0.455 | 0.061 |
| ukrainian wikisource (main page) from a Wikimedia project/tool/bot | 0.537 | 0.179 |
| english wikinews (main page) from elsewhere | 0.546 | 0.068 |
| crimean tatar wikipedia (main page) from a search engine | 0.587 | -0.351 |
| crimean tatar wikipedia (main page) from elsewhere | 0.606 | -0.103 |
| ukrainian wikisource (other pages) from elsewhere | 0.700 | 0.204 |
| german wiktionary (main page) direct (e.g. bookmark or homepage) | 0.709 | 0.029 |
| english wikivoyage (main page) from elsewhere | 0.713 | 0.107 |
| crimean tatar wikipedia (main page) from Wikipedia.org Portal | 0.767 | -0.017 |
| ukrainian wikibooks (main page) from a Wikimedia project/tool/bot | 0.770 | -0.064 |
| crimean tatar wikipedia (main page) from a Wikimedia project/tool/bot | 0.811 | 0.021 |
| russian wiktionary (main page) from elsewhere | 0.876 | -0.001 |
| ukrainian wikibooks (other pages) from elsewhere | 0.878 | 0.024 |
| ukrainian wiktionary (other pages) from elsewhere | 1.114 | 0.032 |
| ukrainian wikiquote (other pages) from elsewhere | 1.131 | -0.098 |
Table 1: Top 20 most similar pageviews to Ukrainian Wikipedia main page pageviews from the Wikipedia.org Portal. These are the time series used as controls in models that use “matched markets”.
| Population | Model Nickname | R² | AIC | BIC | Estimate (PVs) | 95% CI (PVs) | |
|---|---|---|---|---|---|---|---|
| 1 | RuBNUkS | Ruwiki Main from Portal | 0.720 | 551.963 | 601.974 | -2.734 | (-78.56, 12.95) |
| 2 | RuBNUkS | No control markets | 0.769 | 551.571 | 599.407 | 1.797 | (-15.33, 34.68) |
| 3 | RuBNUkS | Matched markets with AR(1) & seasonalities | 0.813 | 589.991 | 681.316 | -0.695 | (-20.78, 20.39) |
| 4 | RuBNUkS | Ukwiki Other from Portal | 0.913 | 556.998 | 607.009 | 0.158 | (-15.72, 19.75) |
| 5 | RuBNUkS | Ruwiki Main from Portal & Ukwiki Other from Portal | 0.921 | 556.006 | 608.191 | -2.489 | (-14.07, 12.41) |
| 6 | RuBNUkS | Selected markets | 0.940 | 557.370 | 613.904 | -1.437 | (-11.42, 9.93) |
| 7 | RuBNUkS | Mix of matched & selected markets | 0.955 | 564.273 | 625.156 | -1.740 | (-11.64, 11.33) |
| 8 | RuBNUkS in Ukraine | Ukraine’s Ruwiki Main from Portal | 0.712 | 522.535 | 572.546 | -1.065 | (-10.19, 8.69) |
| 9 | RuBNUkS in Ukraine | No control markets | 0.835 | 528.735 | 576.571 | 2.044 | (-19.44, 18.86) |
- Russian Wikipedia Main Page pageviews from the Wikipedia.org Portal
- No control time series.
- DTW-matched time series.
- Ukrainian Wikipedia non-Main pageviews from the Wikipedia.org Portal
- 1 and 4
-
The following control time series:
- Russian Wikipedia Main Page pageviews from the Wikipedia.org Portal
- German Wikipedia Main Page pageviews from the Wikipedia.org Portal
- Ukrainian Wikipedia non-Main Page pageviews from the Wikipedia.org Portal
- Ukrainian Wikipedia Main Page pageviews not from the Wikipedia.org Portal
- Ukrainian Wikipedia Main Page pageviews from a Wikimedia project/tool/bot
- Top 2 DTW-matched time series as controls, along with the selection listed in 6.
- Russian Wikipedia Main Page pageviews from the Wikipedia.org Portal visitors in Ukraine
- No control time series.
| Population | Model Nickname | R² | AIC | BIC | Estimate (PVs) | 95% CI (PVs) | |
|---|---|---|---|---|---|---|---|
| 1 | RuBNUkS | Ukwiki Other from Portal | 0.913 | 556.998 | 607.009 | 0.158 | (-15.72, 19.75) |
| 2 | RuBNUkS | Ruwiki Main from Portal & Ukwiki Other from Portal | 0.921 | 556.006 | 608.191 | -2.489 | (-14.07, 12.41) |
| 3 | RuBNUkS | Selected markets | 0.940 | 557.370 | 613.904 | -1.437 | (-11.42, 9.93) |
| 4 | RuBNUkS | Mix of matched & selected markets | 0.955 | 564.273 | 625.156 | -1.740 | (-11.64, 11.33) |
| 5 | UkBNRuS | No control markets | 0.977 | 620.017 | 667.854 | 1.707 | (-23.63, 44.29) |
| 6 | UkBNRuS | Ukwiki Main not from Portal & Ukwiki Other from Portal | 0.989 | 623.273 | 673.284 | 1.594 | (-16.86, 23.83) |
| 7 | UkBNRuS in Ukraine | No control markets | 0.966 | 608.024 | 655.860 | -1.345 | (-24.30, 21.03) |
| 8 | UkBNRuS in Ukraine | Ukwiki Main not from Portal & Ukwiki Other from Portal | 0.983 | 609.551 | 659.562 | -0.409 | (-30.85, 15.44) |
| 9 | UkARuS | No control markets | 0.978 | 580.570 | 628.406 | -1.365 | (-18.47, 18.43) |
| 10 | UkARuS | Ruwiki & Ukwiki | 0.986 | 586.019 | 640.379 | 0.901 | (-15.82, 21.24) |
| 11 | UkARuS in Ukraine | No control markets | 0.979 | 569.233 | 617.070 | 2.122 | (-13.08, 17.06) |
| 12 | UkARuS in Ukraine | Ruwiki & Ukwiki | 0.986 | 575.922 | 630.282 | -4.231 | (-18.03, 11.30) |
| 13 | All Speakers | No control markets | 0.957 | 694.194 | 742.030 | -43.092 | (-87.62, 14.27) |
| 14 | All Speakers | Ruwiki Main from Portal | 0.969 | 694.965 | 744.976 | -33.263 | (-86.00, 16.90) |
| 15 | All Speakers | Ruwiki Main from Portal & Ukwiki Other from Portal | 0.980 | 697.172 | 749.358 | -29.345 | (-84.60, 39.56) |
| 16 | All Speakers | Ukwiki Other from Portal | 0.983 | 696.811 | 746.822 | -16.427 | (-71.52, 36.57) |
| 17 | All Speakers in Ukraine | Ruwiki Main from Portal | 0.942 | 662.374 | 712.385 | -2.224 | (-43.47, 45.66) |
| 18 | All Speakers in Ukraine | Ukwiki Other from Portal | 0.966 | 663.672 | 713.683 | -8.058 | (-64.75, 71.73) |
| 19 | All Speakers in Ukraine | No control markets | 0.973 | 664.458 | 712.295 | -0.306 | (-43.46, 27.58) |
| 20 | All Speakers in Ukraine | Ruwiki Main from Portal & Ukwiki Other from Portal | 0.979 | 664.830 | 717.015 | -2.787 | (-32.64, 16.88) |
Table 3: Summary metrics — R2, Akaike information criterion (AIC), Schwarz criterion (BIC) — and point estimate (in pageviews) & 95% credible interval of the effect of the Wikipedia.org Portal’s secondary link collapse patch deployment as estimated by the following models:
- Ukrainian Wikipedia non-Main Page pageviews from the Wikipedia.org Portal
- Russian Wikipedia Main Page pageviews from Portal and Ukrainian Wikipedia non-Main Page pageviews from the Wikipedia.org Portal
-
Selected control time series:
- Russian Wikipedia Main Page pageviews from the Wikipedia.org Portal
- German Wikipedia Main Page pageviews from the Wikipedia.org Portal
- Ukrainian Wikipedia non-Main Page pageviews from the Wikipedia.org Portal
- Ukrainian Wikipedia Main Page pageviews not from the Wikipedia.org Portal
- Ukrainian Wikipedia Main Page pageviews from a Wikimedia project/tool/bot
- Top 2 DTW-matched time series and selected control time series (see list above).
- No control time series.
The different models were fit for the following the following populations:
- “RuBNUkS”: Russian-but-not-Ukrainian-speaking visitors. These are users who had Russian but not Ukrainian in their accept-language header, and are of primary interest in this analysis.
- “UkBNRuS”: Ukrainian-but-not-Russian-speaking visitors.
- “UkARuS”: Ukrainian-AND-Russian-speaking visitors.
- For all visitors (“All Speakers”), we did not filter the pageviews by presence of Ukrainian or Russian in the accept-language header.
We also fit versions of the models for pageviews that specifically came from IP addresses in Ukraine.
In Tables 2 and 3 above, we list several well-fitting models (high R2) and show the estimated effect of the deployment. Also included are the 95% credible intervals, which can be interpreted as “there is a 95% probability that the true value of the effect is inside this interval”. Whether looking at models of Ukranian Wikipedia Main Page pageviews from Russian-but-not-Ukrainian-speaking visitors to the Wikipedia.org Portal or the other models, the effect of the deployment was estimated to be positive in some models and negative in others, and not statistically significant (95% credible interval included 0) in all of them, meaning that we do not have evidence to say that the deployment had a reliably positive or a negative impact.
References
Reading
- Scott, S. L., and Varian, H. R. (2014). Predicting the present with bayesian structural time series. International Journal of Mathematical Modelling and Numerical Optimisation, 5(1/2), 4. http://doi.org/10.1504/ijmmno.2014.059942
- Brodersen, K. H., Gallusser, F., and Koehler, J. (2015). Inferring causal impact using Bayesian structural time-series models. The Annals of Applied Statistics. http://doi.org/10.1214/14-AOAS788, http://research.google.com/pubs/pub41854.html
- Larsen, K. (2016, January 13). Making Causal Impact Analysis Easy [Blog post]. Retrieved from http://multithreaded.stitchfix.com/blog/2016/01/13/market-watch/
- Larsen, K. (2016, April 21). Sorry ARIMA, but I’m Going Bayesian [Blog post]. Retrieved from http://multithreaded.stitchfix.com/blog/2016/04/21/forget-arima/
Software
- R Core Team (2016). R: A Language and Environment for StatisticalComputing. R Foundation for Statistical Computing, Vienna,Austria. https://www.R-project.org/
- Dowle M, Srinivasan A, Short T, Saporta SLwcfR and Antonyan E(2015). data.table: Extension of Data.frame. R package version1.9.6, https://CRAN.R-project.org/package=data.table
- Scott SL (2016). bsts: Bayesian Structural Time Series. Rpackage version 0.6.5, https://CRAN.R-project.org/package=bsts
- Giorgino T (2009). “Computing and Visualizing Dynamic Time WarpingAlignments in R: The dtw Package.” Journal of StatisticalSoftware, 31(7), pp. 1-24. http://www.jstatsoft.org/v31/i07/
- Tormene P, Giorgino T, Quaglini S and Stefanelli M (2008).“Matching Incomplete Time Series with Dynamic Time Warping: AnAlgorithm and an Application to Post-Stroke Rehabilitation.”Artificial Intelligence in Medicine, 45(1), pp. 11-34. doi:10.1016/j.artmed.2008.11.007 (URL:http://doi.org/10.1016/j.artmed.2008.11.007).
- Kim L (2015). MarketMatching: Market matching and causal impactinference. R package version 0.0.1.
- Bache SM and Wickham H (2014). magrittr: A Forward-Pipe Operatorfor R. R package version 1.5, https://CRAN.R-project.org/package=magrittr
- Wickham H (2009). ggplot2: Elegant Graphics for Data Analysis.Springer-Verlag New York. ISBN 978-0-387-98140-6, http://ggplot2.org
- Allaire J, Cheng J, Xie Y, McPherson J, Chang W, Allen J, WickhamH, Atkins A and Hyndman R (2016). rmarkdown: Dynamic Documentsfor R. R package version 1.0, https://CRAN.R-project.org/package=rmarkdown
- Xie Y (2016). knitr: A General-Purpose Package for Dynamic ReportGeneration in R. R package version 1.14, http://yihui.name/knitr/
- Xie Y (2015). Dynamic Documents with R and knitr, 2nd edition.Chapman and Hall/CRC, Boca Raton, Florida. ISBN 978-1498716963, http://yihui.name/knitr/
- Xie Y (2014). “knitr: A Comprehensive Tool for ReproducibleResearch in R.” In Stodden V, Leisch F and Peng RD (eds.),Implementing Reproducible Computational Research. Chapman andHall/CRC. ISBN 978-1466561595, http://www.crcpress.com/product/isbn/9781466561595