Test of the Explore Similar Widget
Providing users with related pages, categories and suggested languages in search results
Erik Bernhardson
Senior Software Engineer, Wikimedia FoundationJan Drewniak
User Experience Engineer, Wikimedia FoundationChelsy Xie
Data Analyst, Wikimedia FoundationDeb Tankersley
Product Manager (Analysis, Search Frontend), Wikimedia Foundation14 September 2017
Abstract
Wikimedia Engineering’s Discovery’s Search team ran an A/B test from 30 Jun 2017 to 24 Jul 2017 to assess the effectiveness of adding ‘explore similar’ widget to provide randomly selected users on English Wikipedia with related pages, categories and suggested languages in addition to each search result. We found that about 10% of users hover over the widget but almost no one clicked on the similar result links. Users hover over the ‘Related’ section most often, followed by ‘Categories’ and ‘Languages’ sections. More than 80% of hovers lasted less than 2 seconds, which means that the user was either not interested in the related content or hovered over the links by accident. Our analysis also showed that this widget did not improve user engagement, but it did not hurt user experience neither. Given the fact that very few users saw the similar results and we got positive feedback from usertesting.com, we suggest making the feature to be more visually distinct and then run another test.
{ RMarkdown Source | Analysis Codebase }
Introduction
In the ongoing effort to improve the discoverability of all the world’s knowledge, the Discovery team is proposing an enhancement to the search result snippets on the search results page on Wikipedia (Special:Search). The goal of this feature is to surface related content for each individual search result, so that even when the search result itself isn’t entirely useful, perhaps its related content could be.
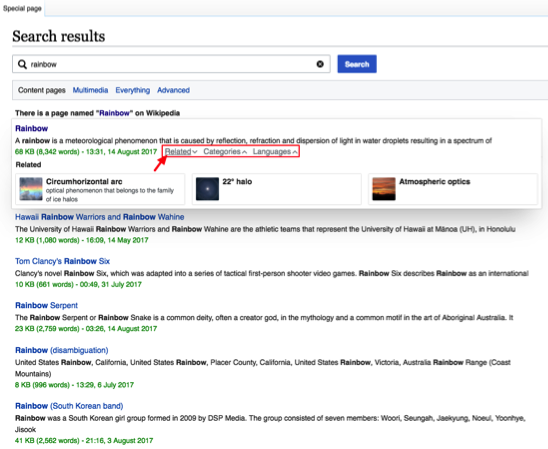
Figure 1: Example of explore similar widget on English Wikipedia when a user move the mouse on the ‘Related’ section of the first search result.
For the users who received the experimental user experience (UX), three new links would be added beside the green metadata on each search result: related pages, categories and languages. When hovered over, these link would expand the search result into a ‘card’ with related content (see Figure 1). These links would reveal the following related content:
Up to 3 related page links containing metadata (as is available): thumbnail image, name of related page and metadata description
Up to 9 links to categories that the article was tagged with
Any other languages the page is available in
This extended content would be activated by hovering over one of the three links. Also, in order to avoid overcrowding the UI, these links would only be visible when hovering over the search result. There was one test group of users who received the experimental UX, and one control group that did not and received the currently existing search results page.
The primary questions we wanted to answer are:
Did users who saw the additional related content engage with those results?
Was the overall engagement with search results better or worse compared to the controls?
On 30 June 2017 we deployed an A/B test on the desktop version of English Wikipedia to assess the efficacy of this feature. The test concluded on 24 July 2017, after a total of 5180 search sessions had been anonymously tracked.
Methods
This test’s event logging (EL) was implemented in JavaScript according to the TestSearchSatisfaction2 (TSS2) schema, which is the one used by the Search team for its metrics on desktop, data was stored in a MySQL database, and analyzed and reported using R (R Core Team 2016).
import::from(dplyr, group_by, ungroup, keep_where = filter, mutate, arrange, select, transmute, left_join, summarize, bind_rows, case_when, if_else, rename, tally)
library(ggplot2)
library(tidyr)
Data
1 in 1000 users are included in Event-logging (on English Wikipedia that’s about 2000 full-text searchers, according to T163273). Of those 1 in 1000 users, 1 in 2 are included in the test (that’s about 1000 sessions daily). Of those 1 in 2 users, 50% go in the test group (as described above), and the other 50% of users will go in the control group (that’s about 500 sessions for each bucket). However, we failed to notice that the sampling didn’t work as we expected – we got only about 100 sessions per day for each bucket. But we got enough data since we ran this test longer than planned – for 25 days.
# De-duplicating events...
events <- events %>%
  mutate(
    timestamp = lubridate::ymd_hms(timestamp),
    date = as.Date(timestamp)
  ) %>%
  arrange(session_id, event_id, timestamp) %>%
  dplyr::distinct(session_id, event_id, .keep_all = TRUE)
rm(events_raw) # to free up memory

# Delete events with negative load time...
events <- events %>%
  keep_where(is.na(load_time) | load_time >= 0)

# De-duplicating SERPs
SERPs <- events %>%
  keep_where(event == "searchResultPage") %>%
  select(c(session_id, page_id, query_hash, search_token)) %>%
  group_by(session_id, query_hash) %>%
  mutate(serp_id = page_id[1], cirrus_id = search_token[1]) %>%
  ungroup %>%
  select(c(page_id, serp_id, cirrus_id))
events <- events %>%
  dplyr::left_join(SERPs, by = "page_id")
rm(SERPs) # to free up memory

# Removing events without an associated SERP (orphan clicks and check-ins)
n_evnt <- nrow(events)
events <- events %>%
  keep_where(!(is.na(serp_id) & !(event %in% c("visitPage", "checkin")))) %>% # remove orphan click
  group_by(session_id) %>%
  keep_where("searchResultPage" %in% event) %>% # remove orphan "visitPage" and "checkin"
  ungroup
rm(n_evnt)

# Removing sessions falling into multiple test groups
temp <- events %>%
  group_by(session_id) %>%
  summarize(unique_group = length(unique(group)) == 1)
events <- events %>%
  keep_where(session_id %in% temp$session_id[temp$unique_group])
rm(temp)

# Number of wikis in the test
n_wiki <- length(unique(events$wiki))

# Remove session with more than 50 searches and only serp
spider_session <- events %>%
  group_by(date, group, session_id) %>%
  summarize(n_search = length(unique(serp_id)),
            only_serp = sum(event == "searchResultPage") == n() & sum(event_scroll) < 1) %>%
  keep_where(n_search > 50, only_serp == TRUE) %>%
  {.$session_id}
events <- events %>%
  keep_where(!(session_id %in% spider_session))

# Scroll on serp
events <- events %>%
  keep_where(!(event %in% c("visitPage", "checkin"))) %>%
  group_by(session_id, page_id) %>%
  summarize(n_scroll_serp = sum(event_scroll)) %>%
  ungroup %>%
  dplyr::right_join(events, by = c("session_id", "page_id"))

# Rename group
events <- events %>%
mutate(group = ifelse(group == "explore_similar_control", "Control", "Test"))load(path("data/fulltext_from_auto.RData"))
# De-duplicating events
fulltext_from_auto <- fulltext_from_auto %>%
mutate(
timestamp = lubridate::ymd_hms(timestamp),
date = as.Date(timestamp),
group = ifelse(group == "explore_similar_control", "Control", "Test")
) %>%
arrange(session_id, event_id, timestamp) %>%
dplyr::distinct(session_id, event_id, .keep_all = TRUE)
# Group by SERPs
serp_from_auto <- fulltext_from_auto %>%
arrange(date, session_id, page_id, timestamp) %>%
group_by(wiki, group, session_id, page_id) %>%
summarize(from_autocomplete = TRUE,
max_checkin_serp = ifelse("checkin" %in% event, max(event_checkin, na.rm = TRUE), 0),
status = ifelse(max_checkin_serp == "420", 1, 2)
)
# Join with events
events <- events %>%
dplyr::left_join(serp_from_auto, by = c("group", "wiki", "session_id", "page_id")) %>%
mutate(from_autocomplete = ifelse(is.na(from_autocomplete), FALSE, from_autocomplete))
# some serp from auto couldn't find a match because their sessions are identified as spider sessions# Aggregating by search
searches <- events %>%
keep_where(!(is.na(serp_id))) %>% # remove visitPage and checkin events
arrange(date, session_id, serp_id, timestamp) %>%
group_by(group, wiki, session_id, serp_id) %>%
summarize(
date = date[1],
timestamp = timestamp[1],
from_autocomplete = sum(from_autocomplete, na.rm = TRUE) > 0,
has_scroll_serp = sum(n_scroll_serp, na.rm = TRUE) > 0,
`got same-wiki results` = any(`some same-wiki results` == "TRUE", na.rm = TRUE),
engaged = any(event != "searchResultPage") || length(unique(page_id[event == "searchResultPage"])) > 1 || any(has_scroll_serp),
engaged_without_es = any(!(event %in% c("searchResultPage", "esclick", "hover-on", "hover-off"))) || length(unique(page_id[event == "searchResultPage"])) > 1,
`same-wiki clickthrough` = "click" %in% event,
`other clickthrough` = sum(grepl("click", event) & event != "click"),
`no. same-wiki results clicked` = length(unique(event_position[event == "click"])),
`first clicked same-wiki results position` = ifelse(`same-wiki clickthrough`, event_position[event == "click"][1], NA), # event_position is 0-based
`max clicked position (same-wiki)` = ifelse(`same-wiki clickthrough`, max(event_position[event == "click"], na.rm = TRUE), NA),
`Query score (F=0.1)` = query_score(event_position, 0.1),
`Query score (F=0.5)` = query_score(event_position, 0.5),
`Query score (F=0.9)` = query_score(event_position, 0.9)
) %>%
ungroup
# Processing explore-similar clicks
esclick_result <- events %>%
keep_where(event == "esclick") %>%
cbind(., do.call(dplyr::bind_rows, lapply(.$event_extraParams, parse_extraParams, action = "esclick"))) %>%
select(group, wiki, session_id, serp_id, page_id, event_id, hoverId, section, result)
searches <- esclick_result %>%
group_by(group, wiki, session_id, serp_id) %>%
summarize(with_esclick = TRUE) %>%
dplyr::right_join(searches, by = c("group", "wiki", "session_id", "serp_id"))
# Processing explore-similar hover events
hover_over <- events %>%
keep_where(event %in% c("hover-on", "hover-off")) %>%
cbind(., do.call(dplyr::bind_rows, lapply(.$event_extraParams, parse_extraParams, action = c("hover-on", "hover-off")))) %>%
select(timestamp, group, wiki, session_id, serp_id, page_id, event_id, event, hoverId, section, results)
searches <- hover_over %>%
keep_where(event == "hover-on") %>%
group_by(group, wiki, session_id, serp_id) %>%
summarize(n_hover = length(unique(hoverId))) %>%
dplyr::right_join(searches, by = c("group", "wiki", "session_id", "serp_id"))
searches <- searches %>%
dplyr::mutate(with_esclick = ifelse(is.na(with_esclick), FALSE, with_esclick),
n_hover = ifelse(is.na(n_hover), 0, n_hover))After the test has concluded on 24 July 2017, we processed the collected data and filtered out duplicated events, extraneous search engine result pages (SERPs), events without an associated SERPs, and remove sessions with more than 50 searches but no interaction with the result. This left us with a total of 5136 search sessions (see Table 1 for the full breakdown by group).
| Test group | Search sessions | Searches recorded |
|---|---|---|
| Control | 2,570 | 4,618 |
| Test | 2,566 | 4,719 |
| Total | 5,136 | 9,337 |
Results
There are around 185 searches everyday in each group, around 170 of them return at least one same-wiki result, and about 65 searches have clickthroughs. In the test group, about 20 searches have hover-over actions (see Figure 2 for daily counts and Figure 3 for daily zero result rates and clickthrough rates). The hover-over rate is 9.8% (see Figure 4).
searches %>%
  group_by(group, date) %>%
  summarize(`All Searches` = n(), `Searches with Results` = sum(`got same-wiki results`), `Searches with Clicks` = sum(`same-wiki clickthrough`), `Searches with Hover` = sum(n_hover > 0)) %>%
  gather(key=Group, value = count, -date, -group) %>%
  ggplot(aes(x=date, y=count, colour=Group)) +
  geom_line(size=1.2) +
  scale_x_date(name = "Date") +
  scale_y_continuous(labels=polloi::compress, name = "Number of Searches") +
  ggtitle("Daily fulltext searches on desktop") +
  facet_wrap(~ group, scales = "free_y") +
  theme_facet(border = FALSE)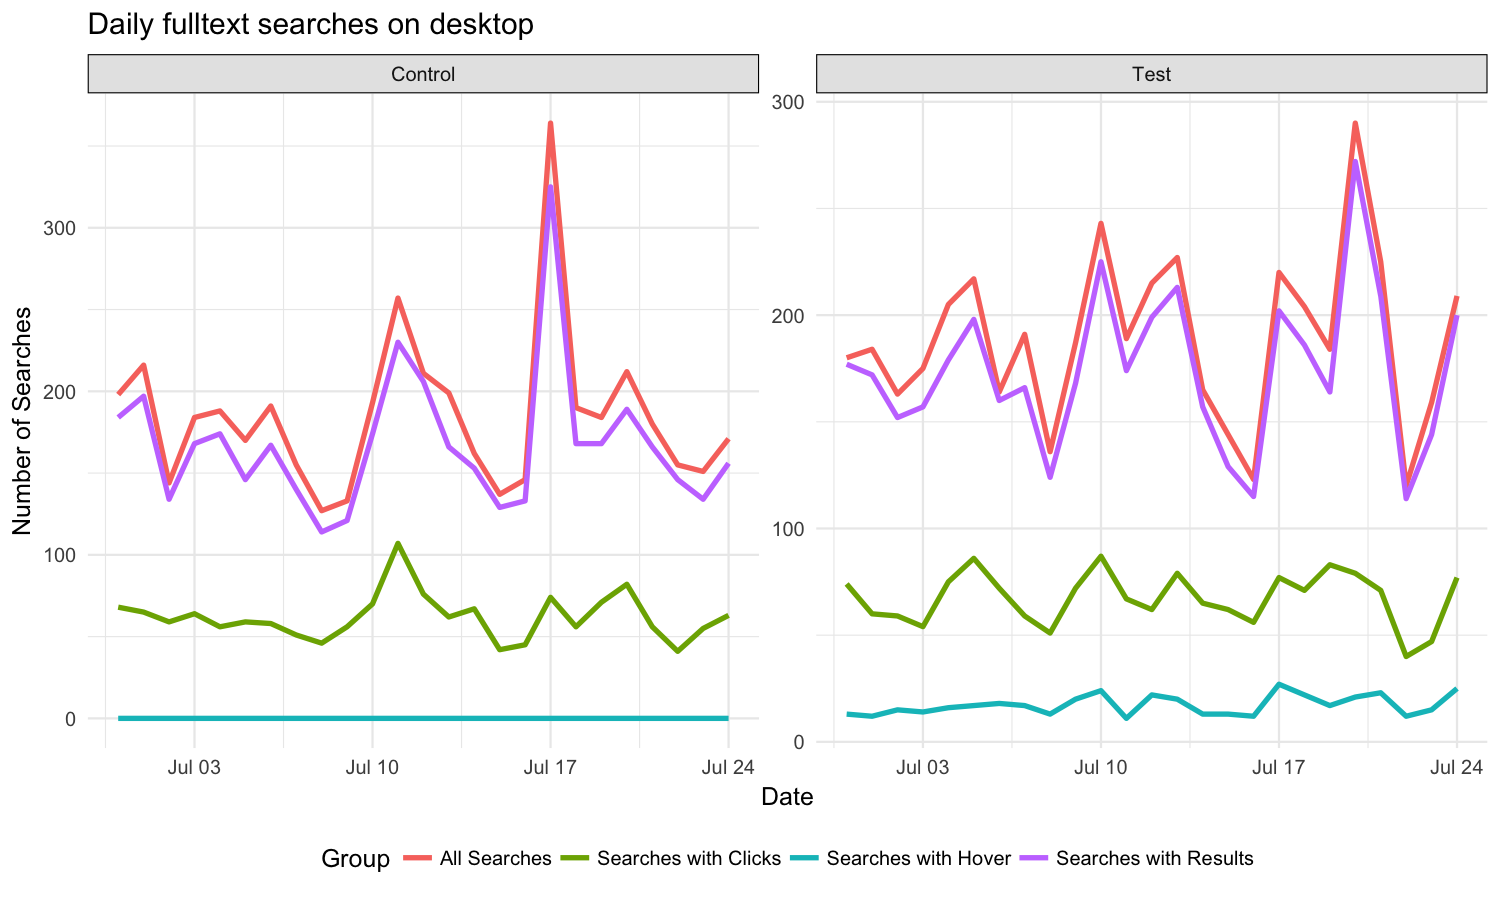
Figure 2: Number of all searches, searches with results, searches with clickthrough and searches with hover-over, by day and group.
zrr <- searches %>%
  group_by(group) %>%
  summarize(zero = sum(!`got same-wiki results`), n_search = n()) %>%
  ungroup %>%
  cbind(
    as.data.frame(binom:::binom.bayes(x = .$zero, n = .$n_search, conf.level = 0.95))
  )
ctr <- searches %>%
  keep_where(`got same-wiki results` == TRUE) %>%
  group_by(group) %>%
  summarize(clickthroughs = sum(`same-wiki clickthrough`), n_search = n()) %>%
  group_by(group) %>%
  dplyr::do(binom::binom.bayes(.$clickthroughs, .$n_search, conf.level = 0.95))
p1 <- searches %>%
group_by(date, group) %>%
summarize(n_search = n(), zero = sum(!`got same-wiki results`)) %>%
ungroup %>%
cbind(
as.data.frame(binom:::binom.bayes(x = .$zero, n = .$n_search, conf.level = 0.95))
) %>%
ggplot(aes(x = date, color = group, y = mean, ymin = lower, ymax = upper)) +
geom_hline(data = zrr, aes(yintercept = mean, color = group), linetype = "dashed") +
geom_ribbon(aes(ymin = lower, ymax = upper, fill = group), alpha = 0.1, color = NA) +
geom_line() +
scale_color_brewer("Group", palette = "Set1") +
scale_fill_brewer("Group", palette = "Set1") +
scale_y_continuous("Zero Results Rate", labels = scales::percent_format()) +
theme_min()
p2 <- searches %>%
keep_where(`got same-wiki results` == TRUE) %>%
group_by(date, group) %>%
summarize(n_search = n(), clickthroughs = sum(`same-wiki clickthrough`)) %>%
ungroup %>%
cbind(
as.data.frame(binom:::binom.bayes(x = .$clickthroughs, n = .$n_search, conf.level = 0.95))
) %>%
ggplot(aes(x = date, color = group, y = mean, ymin = lower, ymax = upper)) +
geom_hline(data = ctr, aes(yintercept = mean, color = group), linetype = "dashed") +
geom_ribbon(aes(ymin = lower, ymax = upper, fill = group), alpha = 0.1, color = NA) +
geom_line() +
scale_color_brewer("Group", palette = "Set1") +
scale_fill_brewer("Group", palette = "Set1") +
scale_y_continuous("Clickthrough Rate", labels = scales::percent_format()) +
theme_min()
cowplot::plot_grid(p1, p2) +
labs(title = "Daily search-wise zero results rate and clickthrough rates by group")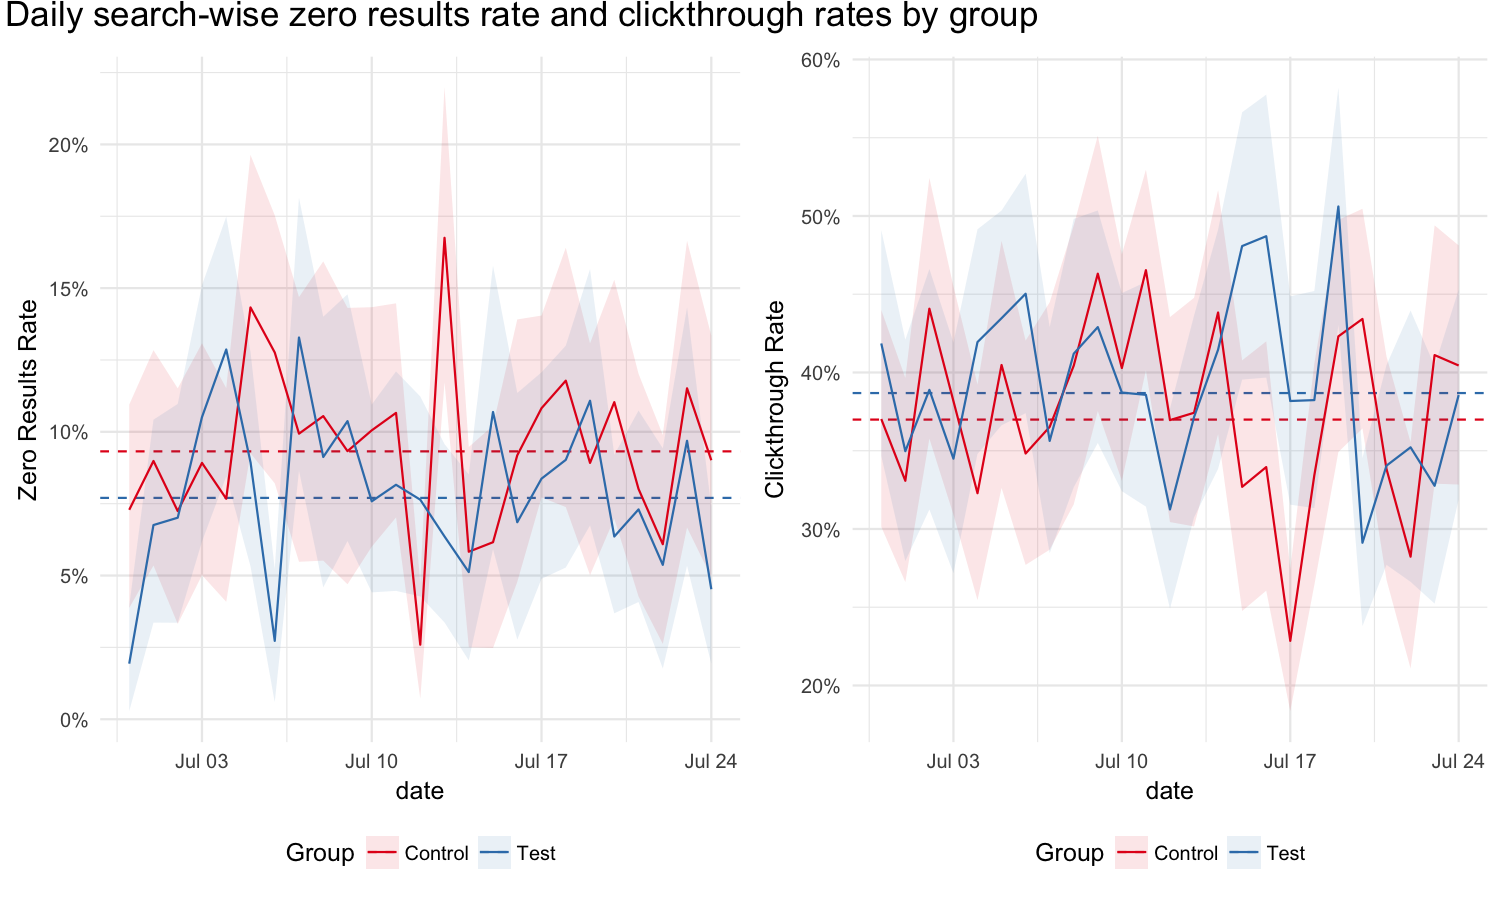
Figure 3: Daily search-wise zero results rate and clickthrough rates of experimental groups. Dashed lines mark the overall zero results rate and clickthrough rate.
hover_rate <- searches %>%
  keep_where(group == "Test", `got same-wiki results`) %>%
  group_by(group) %>%
  summarize(hover = sum(n_hover > 0), n_search = n()) %>%
  ungroup %>%
  cbind(
    as.data.frame(binom:::binom.bayes(x = .$hover, n = .$n_search, conf.level = 0.95))
  )
searches %>%
keep_where(group == "Test", `got same-wiki results`) %>%
group_by(group, date) %>%
summarize(hover = sum(n_hover > 0), n_search = n()) %>%
ungroup %>%
cbind(
as.data.frame(binom:::binom.bayes(x = .$hover, n = .$n_search, conf.level = 0.95))
) %>%
ggplot(aes(x = date, color = "#377EB8", y = mean, ymin = lower, ymax = upper)) +
geom_hline(data = hover_rate, aes(yintercept = mean, color = "#377EB8"), linetype = "dashed") + #9.8%
geom_ribbon(aes(ymin = lower, ymax = upper, fill = "#377EB8"), alpha = 0.1, color = NA) +
geom_line() +
scale_color_manual("Group", values = "#377EB8", labels = "Test") +
scale_fill_manual("Group", values = "#377EB8", labels = "Test") +
scale_y_continuous("Hover-over Rate", labels = scales::percent_format()) +
theme_min() +
labs(title = "Daily search-wise hover-over rates")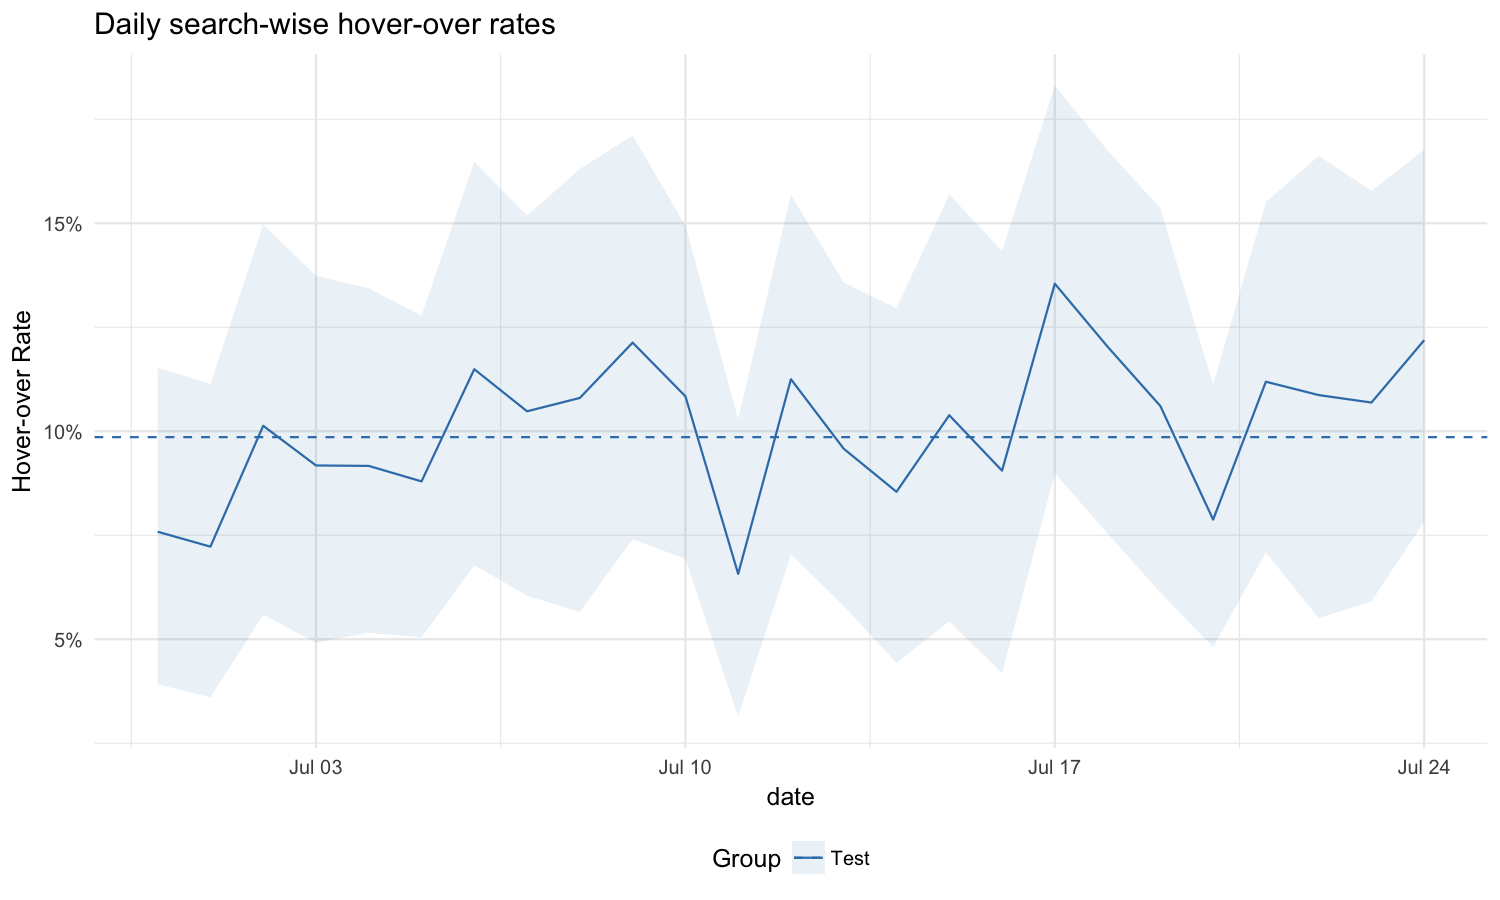
Figure 4: Daily search-wise hover-over rate of the test group. Dashed lines mark the overall hover-over rate.
Engagement with the results
Figure 5 compares same-wiki clickthrough rates between control and test group, and also shows the clickthrough rates among searches with at least one hover-over. The three clickthrough rates are not significantly different, which means showing related information didn’t lead to a higher clickthrough rate.
searches %>%
  keep_where(`got same-wiki results` == TRUE, n_hover > 0) %>%
  group_by(group) %>%
  summarize(clickthroughs = sum(`same-wiki clickthrough`), n_search = n()) %>%
  dplyr::do(binom::binom.bayes(.$clickthroughs, .$n_search, conf.level = 0.95)) %>%
  mutate(group = "With Hover") %>%
  dplyr::bind_rows(ctr) %>%
  pointrange_chart(y_lab = "Clickthrough rate", title = "Same-wiki clickthrough rates by test group and clickthrough rate among searches with hover-over",
                   subtitle = "With 95% credible intervals.") +
  theme_facet(border = FALSE, clean_xaxis = TRUE)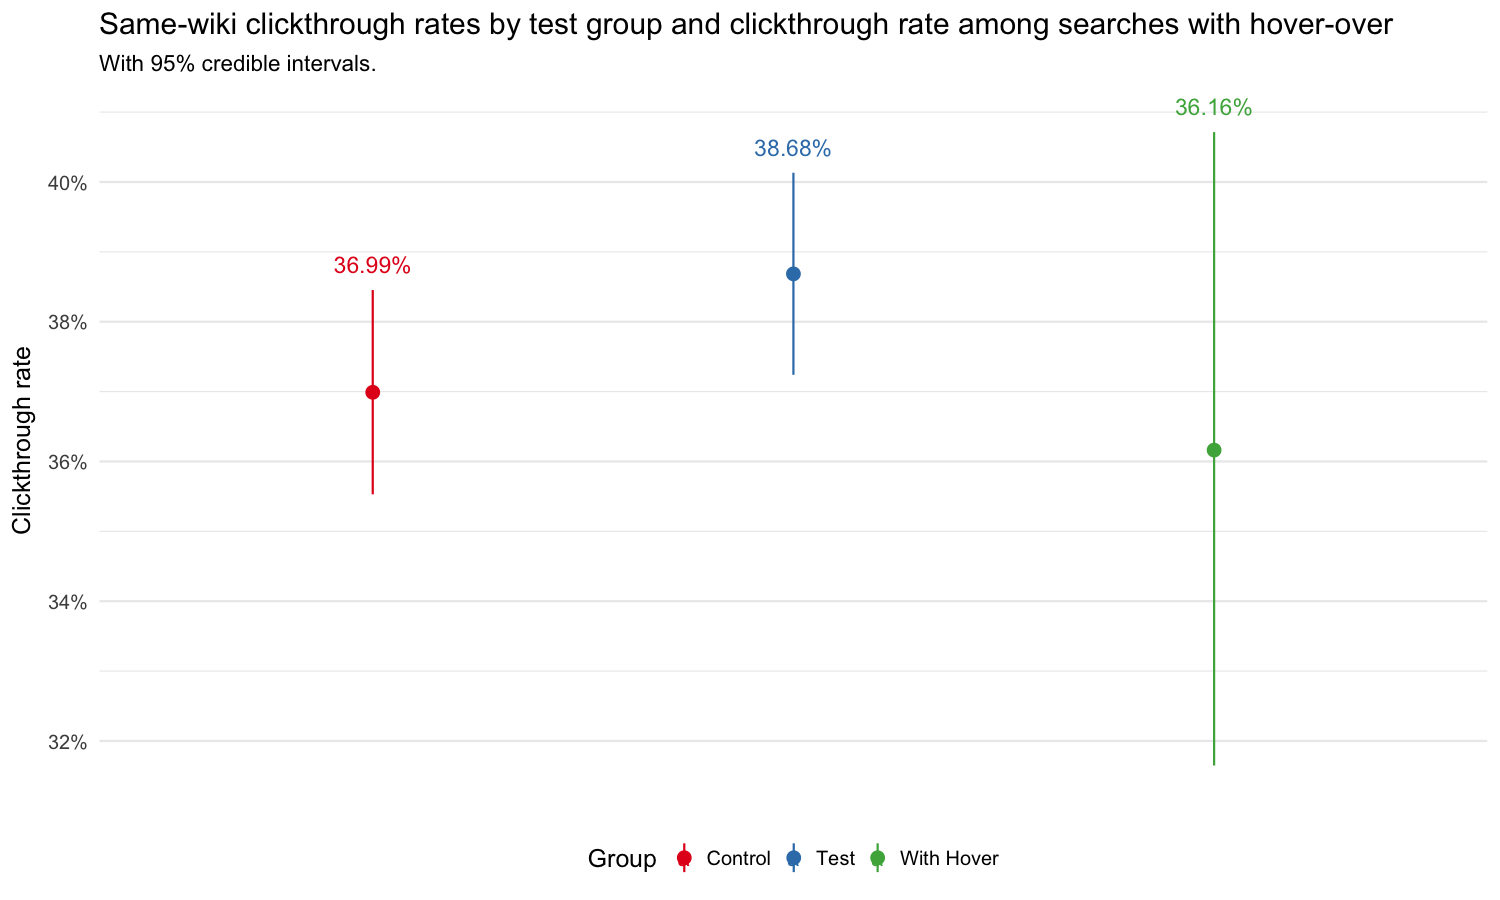
Figure 5: Clickthrough rates of experimental groups and clickthrough rate among searches with hover-over.
After we show the search result page to a user, if the user doesn’t do anything – no click, scroll, hover-over, not reload the search result page or check the next page of results, we will say this search is abandoned. In Figure 6, the left graph shows the proportion of searches without any actions on the result page, and the abandon rate of test group is significantly lower. However, the left graph is not comparing apples to apples, because:
The control group didn’t track hover-over and explore similar clicks and we cannot prove that the hover-over in test group didn’t happen by accident. In other words, the control group users might move their mouse on the pages, but they didn’t get recorded;
According to our EL schema, the more actions are recorded, the more likely a scroll can be recorded, thus a scroll in the test group is more likely to be tracked (Although Figure 7 shows that the proportion of search result pages with scroll in the test group is not significantly higher.).
Therefore we exclude hover-over, explore similar clicks and scrolls, and generate the right graph which shows the proportion of searches that have no click, reload or page-turn. There is no significant difference between the two groups, which means the test group did not have more search result page reload, page-turn and clicks of any kind (same-wiki, cross-wiki or other).
p1 <- searches %>%
  keep_where(`got same-wiki results` == TRUE) %>%
  group_by(group) %>%
  summarize(abandon = n() - sum(engaged), n_search = n()) %>%
  ungroup %>%
  cbind(
    as.data.frame(binom:::binom.bayes(x = .$abandon, n = .$n_search, conf.level = 0.95))
  ) %>%
  pointrange_chart(y_lab = "Search Abandon Rate", title = "Proportion of abandoned searches") +
  theme_facet(border = FALSE, clean_xaxis = TRUE)
p2 <- searches %>%
  keep_where(`got same-wiki results` == TRUE) %>%
  group_by(group) %>%
  summarize(abandon = n() - sum(engaged_without_es), n_search = n()) %>%
  ungroup %>%
  cbind(
    as.data.frame(binom:::binom.bayes(x = .$abandon, n = .$n_search, conf.level = 0.95))
  ) %>%
  pointrange_chart(y_lab = "Search Abandon Rate", title = "Proportion of abandoned searches",
                   subtitle = "Excluding hover-over, explore similar clicks and scrolls.") +
  theme_facet(border = FALSE, clean_xaxis = TRUE)
cowplot::plot_grid(p1, p2)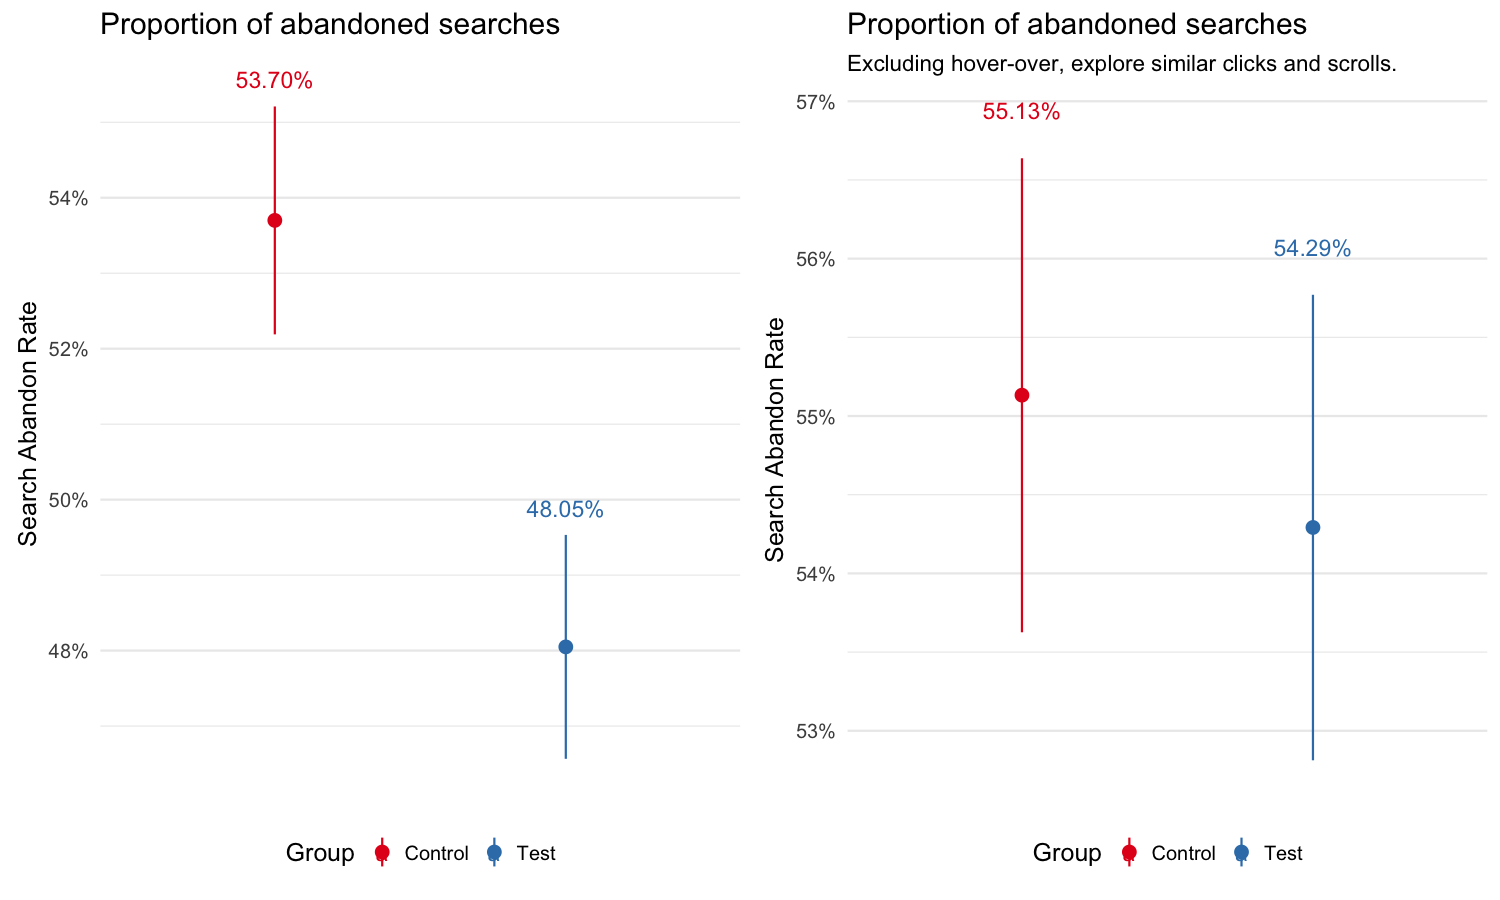
Figure 6: Search abandon rate by test group. The graph on the left shows the proportion of searches without any actions on the result page. The right one shows the proportion of searches that have no click, reload or page-turn.
events %>%
  keep_where(event == "searchResultPage", `some same-wiki results` == TRUE) %>%
  group_by(group) %>%
  summarize(scrolls = sum(n_scroll_serp > 0), n_serp = n()) %>%
  ungroup %>%
  cbind(
    as.data.frame(binom:::binom.bayes(x = .$scrolls, n = .$n_serp, conf.level = 0.95))
  ) %>%
  pointrange_chart(y_lab = "Proportion of SERPs",
                   title = "Proportion of SERPs with scroll by test group",
                   subtitle = "With 95% credible intervals.") +
  theme_facet(border = FALSE, clean_xaxis = TRUE)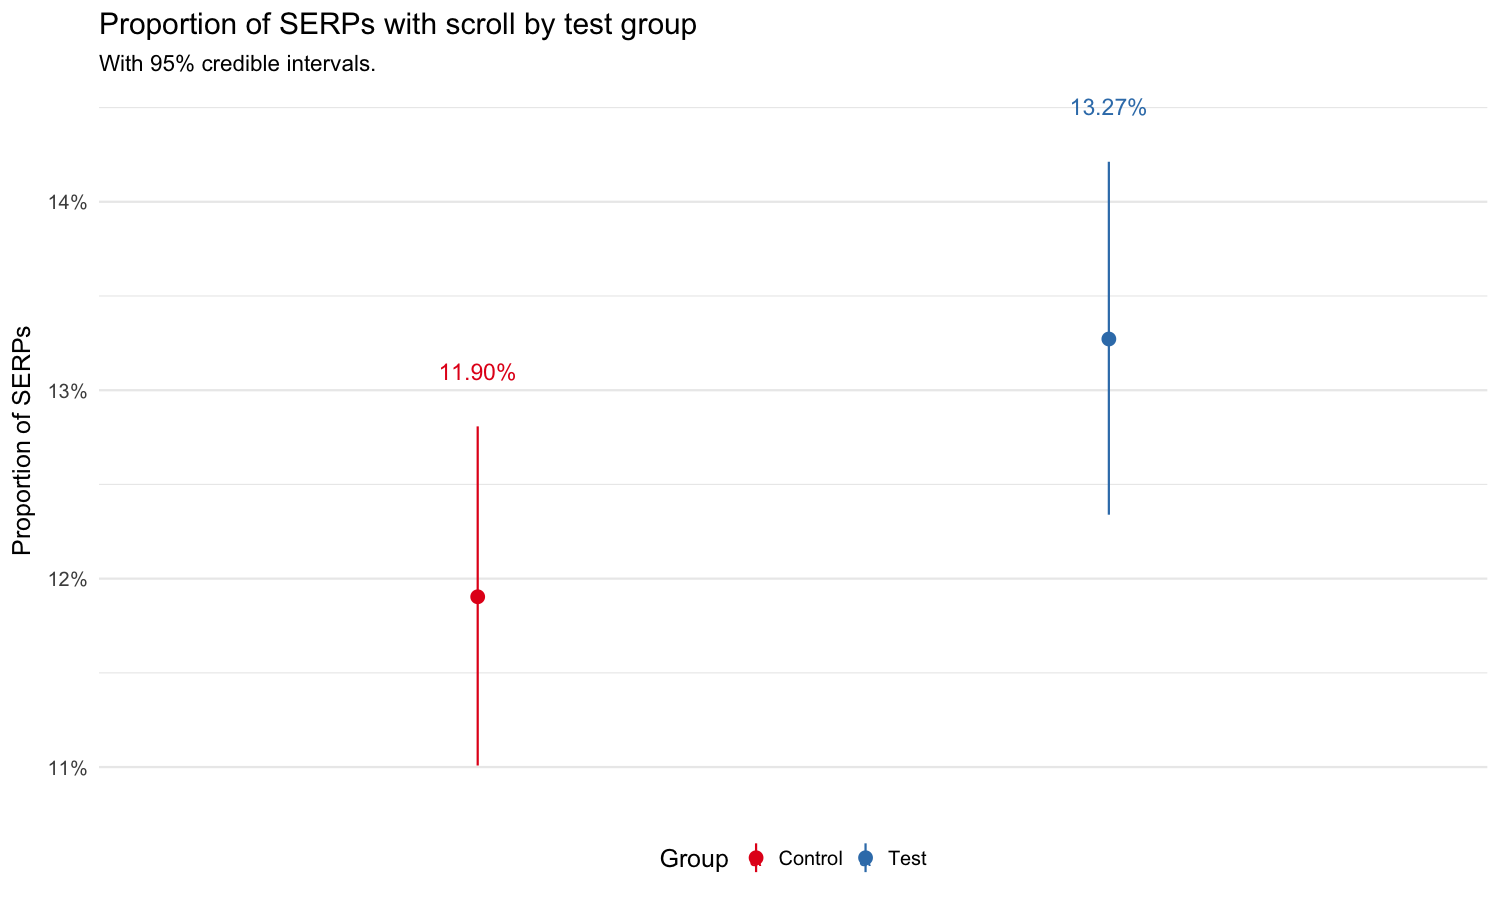
Figure 7: Proportion of search results pages with scroll by test group.
Figure 8 shows that the time users spent on search result pages are not significantly different.
temp <- events %>% keep_where(event == "searchResultPage", from_autocomplete == TRUE, `some same-wiki results` == TRUE)
temp$SurvObj <- with(temp, survival::Surv(max_checkin_serp, status == 2))
fit <- survival::survfit(SurvObj ~ group, data = temp)
ggsurv <- survminer::ggsurvplot(
  fit,
  conf.int = TRUE,
  xlab = "T (Dwell Time in seconds)",
  ylab = "Proportion of SERPs longer than T (P%)",
  surv.scale = "percent",
  palette = "Set1",
  legend = "bottom",
  legend.title = "Group",
  legend.labs = c("Control", "Test"),
  ggtheme = theme_min()
)
ggsurv$plot +
  labs(
    title = "Survival curves by test group",
    subtitle = "With 95% confidence intervals."
  )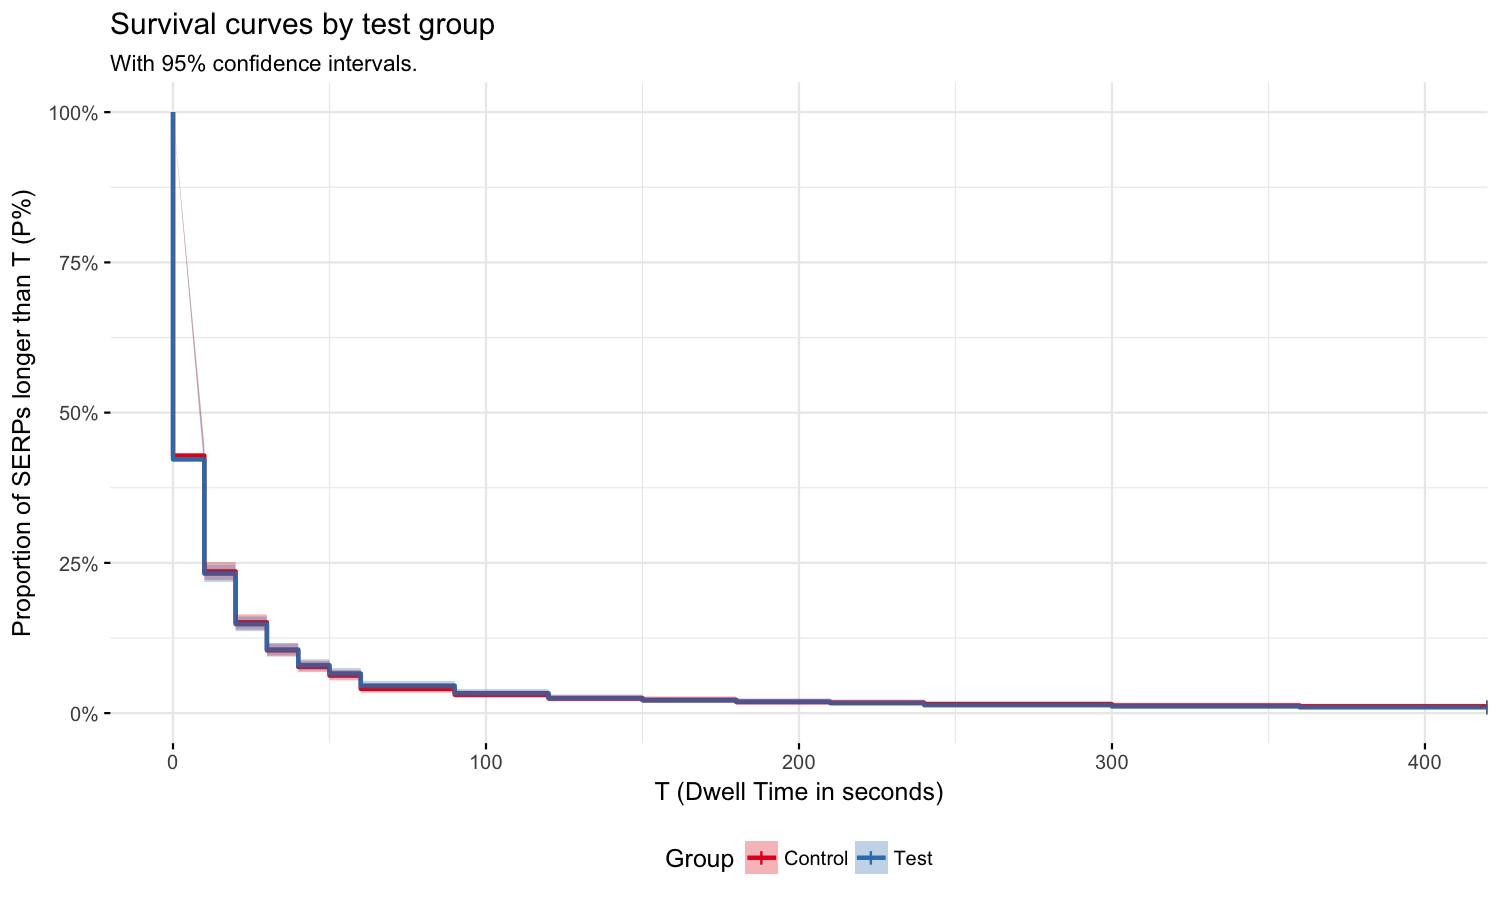
Figure 8: Proportion of search results pages from autocomplete last longer than T. Currently we are only able to track the dwell time of search result pages from autocomplete search.
rm(temp)Interactions with explore similar widget
There are 721 hover-on actions and Table 2 shows the breakdown by section and number of results shown. 12.8% (92) hovers sees 0 result, most of them are in the “Languages” section. 44.1% (318) hover on the “Related” section, 34% (245) hover on the “Categories” section and 21.9% (158) hover on the “Language” section.
| 0 results | 1 result | 2 results | 3 results | 4 results | 5+ results | Sum | |
|---|---|---|---|---|---|---|---|
| categories | 2 | 23 | 28 | 44 | 37 | 111 | 245 |
| languages | 83 | 24 | 14 | 12 | 8 | 17 | 158 |
| related | 7 | 0 | 0 | 311 | 0 | 0 | 318 |
| Sum | 92 | 47 | 42 | 367 | 45 | 128 | 721 |
Table 31 shows the approximate time users stay on the widget after they hover-on. More than 80% of hovers lasted less than 2 seconds, which means that the user is either not interested in the related content or hovered over the links by accident.
hover_over %>%
  group_by(hoverId) %>%
  keep_where(length(event_id) == 2 & all(c("hover-on", "hover-off") %in% event)) %>%
  arrange(timestamp) %>%
  summarize(`Dwell Time` = difftime(max(timestamp), min(timestamp), units="secs")) %>%
  mutate(`Dwell Time` = ifelse(`Dwell Time` > 5, "6+ secs", paste(`Dwell Time`, "secs"))) %>%
  group_by(`Dwell Time`) %>%
  summarize(`Number of Hover-over` = n()) %>%
  mutate(Proportion = paste0(round(`Number of Hover-over` / sum(`Number of Hover-over`) * 100, 2), "%")) %>%
fable(format_caption(table_caps, "Hover Time"))| Dwell Time | Number of Hover-over | Proportion |
|---|---|---|
| 0 secs | 196 | 50.39% |
| 1 secs | 128 | 32.9% |
| 2 secs | 34 | 8.74% |
| 3 secs | 11 | 2.83% |
| 4 secs | 4 | 1.03% |
| 5 secs | 4 | 1.03% |
| 6+ secs | 12 | 3.08% |
There are only 3 valid clicks on the explore similar results from 3 different sessions. There are 1 click on the first “Related” result and 2 clicks on the second “Related” result.
Unfortunately, we didn’t record the position of the same-wiki search result when users interact with the explore similar widget.
Return Rate
Users may click back to the search result page directly after they clickthrough to an article (within 10 mins). We computed two kinds of return rate:
Among users with at least a click in their search, the proportion of searches that return to the same search page
Among users with at least a click in their search session, the proportion of sessions that return to search for different things (different search result page but in the same session)
From Figure 9, we can see the return rates are not significantly different between experimental groups.
returnRate_to_same_search <- events %>%
  keep_where(!(event %in% c("visitPage", "checkin"))) %>%
  group_by(group, serp_id) %>%
  keep_where(sum(grepl("click", event)) > 0) %>% # Among search with at least 1 click
  arrange(group, serp_id, timestamp) %>%
  mutate(n_click_cumsum = cumsum(grepl("click", event))) %>%
  keep_where(n_click_cumsum > 0) %>% # delete serp and hover before first click
  summarize(comeback = sum(event %in% c("searchResultPage", "hover-on", "hover-off")) > 0 | sum(n_click_cumsum > 1) > 0) %>% # comeback to the same serp or make another click or hover
  group_by(group) %>%
  summarize(return_to_same_search = sum(comeback), n_search = length(unique(serp_id))) %>%
  group_by(group) %>%
  dplyr::do(binom::binom.bayes(.$return_to_same_search, .$n_search, conf.level = 0.95))

returnRate_to_other_search <- events %>%
  keep_where(!(event %in% c("visitPage", "checkin"))) %>%
  group_by(group, session_id) %>%
  keep_where(sum(grepl("click", event)) > 0) %>% # Among session with at least 1 click
  arrange(group, session_id, timestamp) %>%
  mutate(n_click_cumsum = cumsum(grepl("click", event))) %>%
  keep_where(n_click_cumsum > 0) %>% # delete serp before first click
  summarize(another_search = length(unique(serp_id)) > 1) %>% # comeback to make another search
  group_by(group) %>%
  summarize(return_to_make_another_search = sum(another_search), n_session = length(unique(session_id))) %>%
  group_by(group) %>%
  dplyr::do(binom::binom.bayes(.$return_to_make_another_search, .$n_session, conf.level = 0.95))

dplyr::bind_rows("Return to the same search page" = returnRate_to_same_search,
                 "Return to make different search" = returnRate_to_other_search, .id = "type") %>%
  pointrange_chart(y_lab = "Return rate", title = "Return rate after users clickthrough on search engine result pages",
                   subtitle = "With 95% credible intervals.") +
  facet_wrap(~ type, scales = "free_y") +
  theme_facet(border = FALSE, clean_xaxis = TRUE)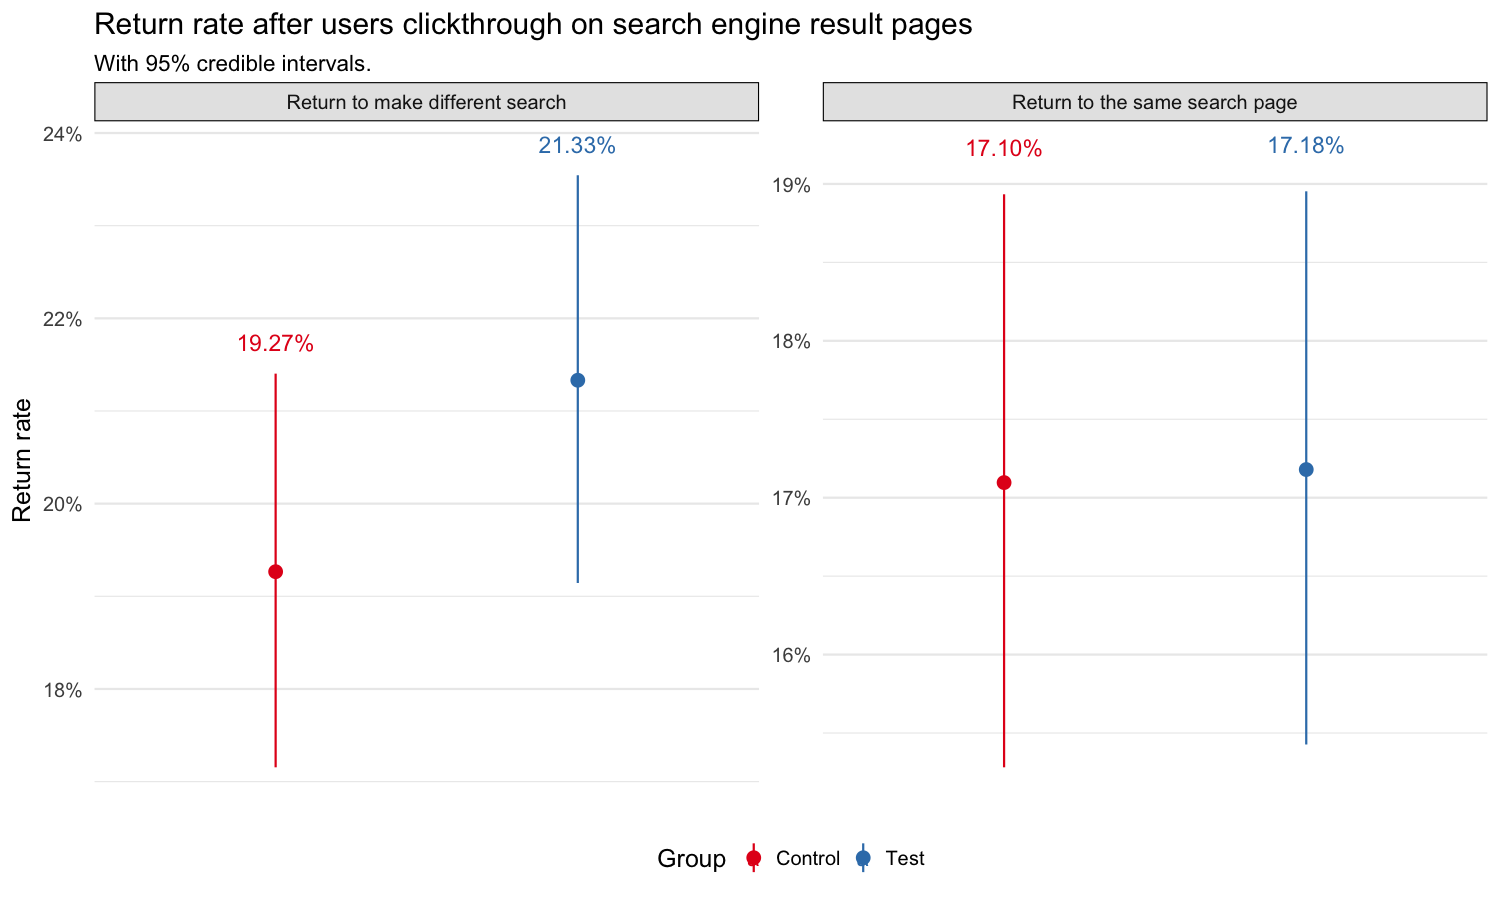
Figure 9: Return rate after users clickthrough on search engine result pages.
Load time of search results pages
Figure 10 shows that the distributions of search result pages’ load time of the two experimental groups almost overlap.
events %>%
  keep_where(event == "searchResultPage", `some same-wiki results` == TRUE) %>%
  ggplot(aes(x=load_time)) +
  scale_x_sqrt() +
  geom_density(aes(group=group, colour=group, fill=group), alpha=0.3) +
  scale_color_brewer("Group", palette = "Set1") +
  scale_fill_brewer("Group", palette = "Set1") +
  labs(x = "Load Time (ms)", y = "Density", title = "Distribution of search result page load time by test group") +
  theme_min()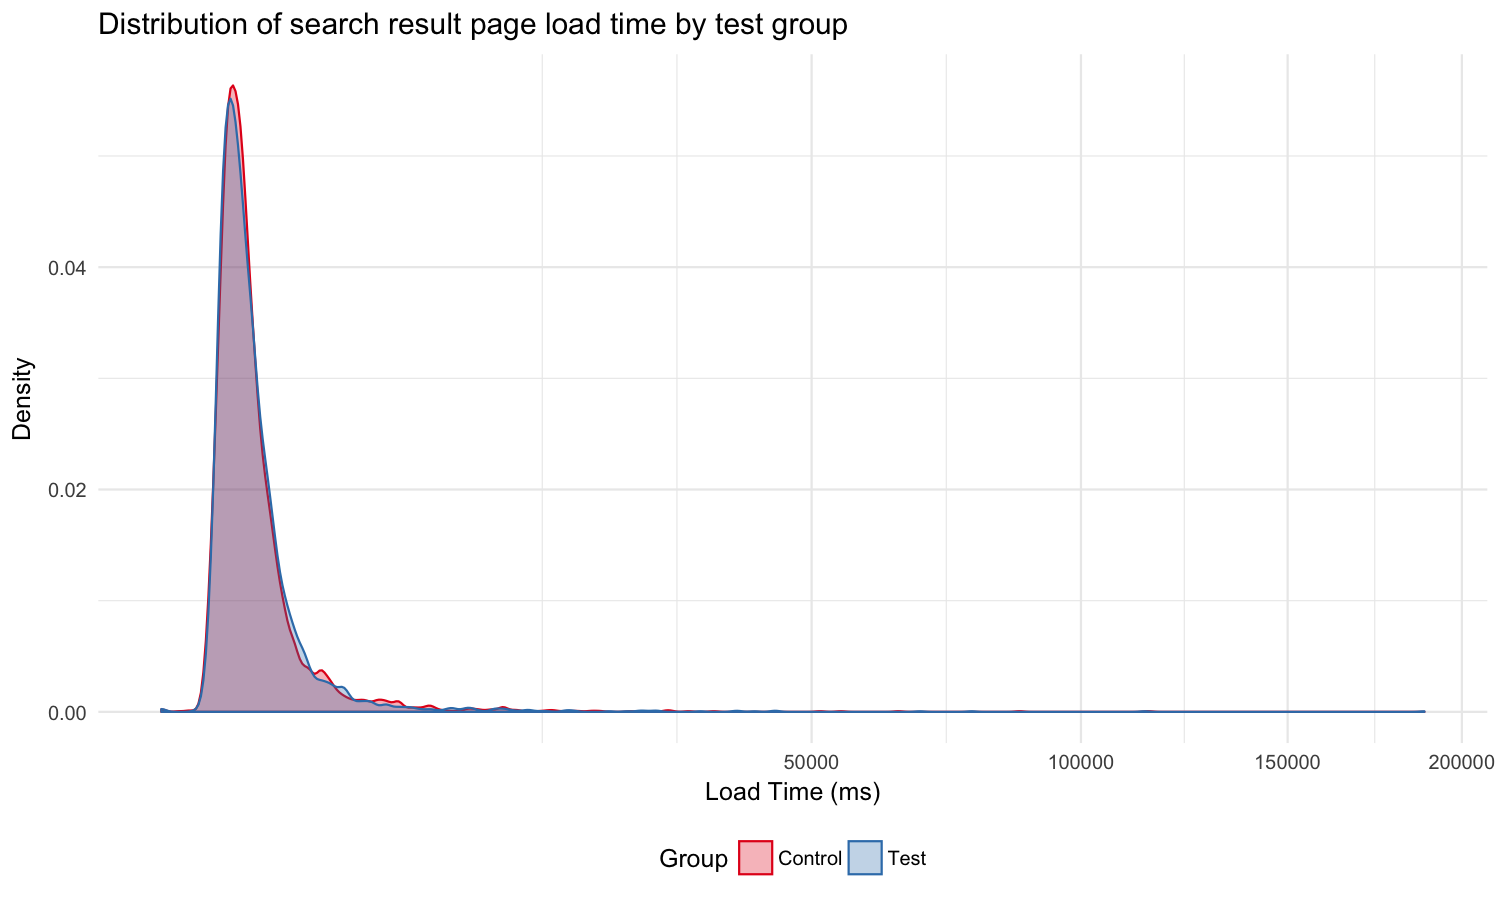
Figure 10: Distribution of search result pages’ load time by test group.
Discussion
We found that about 10% of users hover over the widget but almost no one clicked on the similar result links. Users hover over the ‘Related’ section most often, followed by ‘Categories’ and ‘Languages’ sections. More than 80% of hovers lasted less than 2 seconds, which means that the user is either not interested in the related content or hovered over the links by accident. Our analysis also showed that this widget did not improve user engagement, but it did not hurt user experience neither. Given the fact that very few users saw the similar results and we got positive feedback from usertesting.com, we suggest making the feature to be more visually distinct but also not too visually obtrusive. Additionally, it would be helpful to record the position of the same-wiki result on the page when users hover-over or click on the related content under it.
Acknowledgements
Finally, we would like to thank our colleague Mikhail Popov (Data Analyst, Wikimedia Foundation) for his review and feedback on this report.
References
Allaire, JJ, Joe Cheng, Yihui Xie, Jonathan McPherson, Winston Chang, Jeff Allen, Hadley Wickham, Aron Atkins, Rob Hyndman, and Ruben Arslan. 2016. Rmarkdown: Dynamic Documents for R. http://rmarkdown.rstudio.com.
Bache, Stefan Milton, and Hadley Wickham. 2014. Magrittr: A Forward-Pipe Operator for R. https://CRAN.R-project.org/package=magrittr.
Keyes, Oliver, and Mikhail Popov. 2017. Wmf: R Code for Wikimedia Foundation Internal Usage. https://phabricator.wikimedia.org/diffusion/1821/.
R Core Team. 2016. R: A Language and Environment for Statistical Computing. Vienna, Austria: R Foundation for Statistical Computing. https://www.R-project.org/.
Wickham, Hadley. 2009. Ggplot2: Elegant Graphics for Data Analysis. Springer-Verlag New York. http://ggplot2.org.
———. 2017. Tidyr: Easily Tidy Data with ’Spread()’ and ’Gather()’ Functions. https://CRAN.R-project.org/package=tidyr.
Wickham, Hadley, and Romain Francois. 2016. Dplyr: A Grammar of Data Manipulation. https://CRAN.R-project.org/package=dplyr.
We computed the dwell time for 389 hover-over events. There are 330 hover-on events without a paired hover-off event because the users moved their mouses over the links so fast that javascript did not fire the hover-off event for them. And there are 2 pairs with duplicated hover-on events but only 1 hover-off event. Therefore, we cannot computed the dwell time for these 332 hover-over event.↩